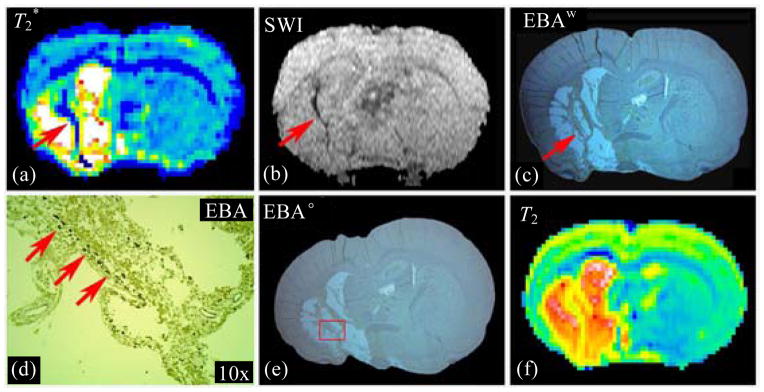
Fig. 8.

Both T2* map (a) and SWI image (b) detected angiogenesis in rat brain after stroke as hypointensity area along ischemic boundary zone. Warped EBA stained image (c) exhibited a line with enriched blood vessels (d), which matched with the hypointensity curve on T2* and SWI images. The magnified picture (d) was from the original EBA stained image (e). T2 map (f) was a referred image in warping procedure
