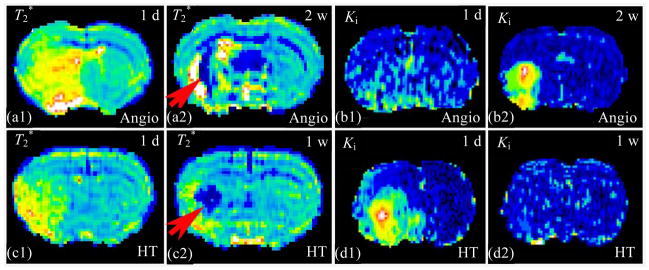
Fig. 9.

T2* evidences of angiogenesis (a) and hemorrhage (c) after stroke could not be distinguished by themselves, excluding shapes and locations. The Ki maps, from the same rats as T2* maps, showed the different temporal patterns. Regional Ki was normal at 1 d and increased at 2 w after stroke indicating angiogenesis (b). Conversely, regional Ki early elevated, a sign BBB disruption, at 1 d and became “normal” at 1 w post stroke, indicating HT (d). Combining complementary measurements would be helpful to distinguish angiogenesis from HT in brain after ischemia
