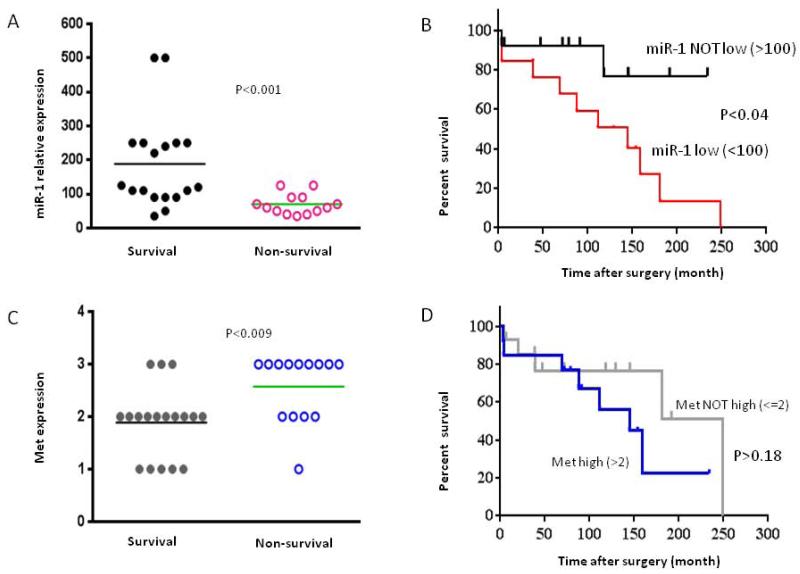
Figure 3.
Correlation of miR-1 and Met with chordoma patient survival. A. Distribution of miR-1 expression in survival and non-survival of chordoma patient samples as determined by real time RT-PCR. B. Analyses of association between expression of miR-1 (miR-1 level low < 100 and miR-1 level not low > 100 and survival in chordoma patients. C. Distribution of Met expression in survival and non-survival of chordoma patient samples as determined by immunohistochemistry. D. Association between expression of Met (Met level <=2+ and Met level >2+) and survival in chordoma patients. Kaplan–Meier survival analysis was used to analyze the correlation between the level of miR-1 or Met expression and survival.

