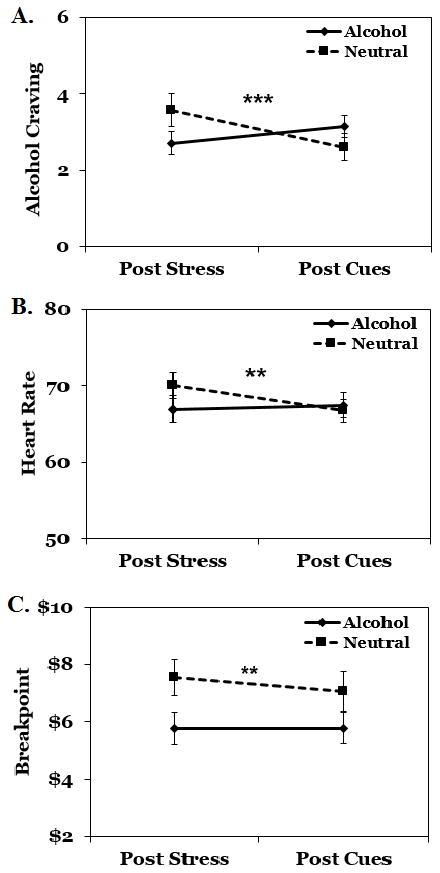
Figure 4. Effects of alcohol cues on arousal, craving, and alcohol demand.

Panel A depicts change in alcohol craving; Panel B depicts change in heart rate; Panel C depicts change in Breakpoint on the alcohol purchase task. Note, in Panel C, the two groups were significantly different at the Post-Stress time point (p = .04). In each panel, solid lines reflect the alcohol cues group; dashed lines reflect the neutral cues group. Data points reflect mean (+/− standard error). **p<.01; ***p<.001.
