Figure 4.

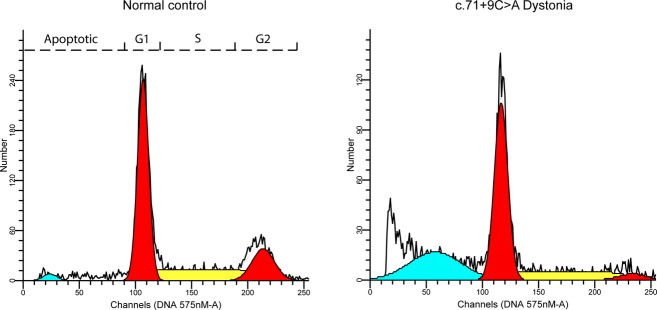
Cell-cycle analysis of lymphoblastoid cell lines. Data from representative normal and c.71+9C>A cells are shown. In comparison to normal cells, the proportion of c.71+9C>A cells in apoptotic phase is increased and G2 phase is decreased.

Cell-cycle analysis of lymphoblastoid cell lines. Data from representative normal and c.71+9C>A cells are shown. In comparison to normal cells, the proportion of c.71+9C>A cells in apoptotic phase is increased and G2 phase is decreased.