
Figure 1.
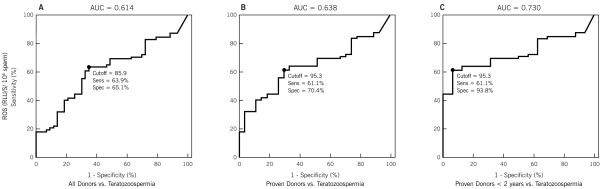
Receiver operator characteristic (ROC) curves for ROS in (A) All Donors; (B) Proven Donors and (C) Proven Donors < 2 years fertility vs. Teratozoospermia group. ROC curves shows the area under the curve for ROS production in Patients with teratozoospermia when compared to All Donors, Proven Donors, and Proven Donors who had initiated pregnancy in the last two years.