Figure 2.

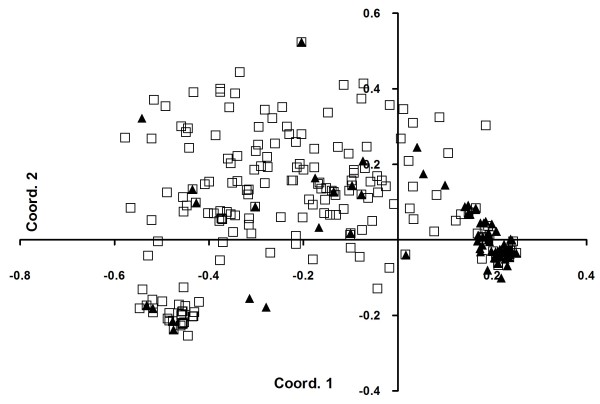
PCoA analysis of 279 suckers (□) and 280 scions (▲). The first axis explained 34.46% of the total variation, the second 7.96%.

PCoA analysis of 279 suckers (□) and 280 scions (▲). The first axis explained 34.46% of the total variation, the second 7.96%.