Fig. 2.
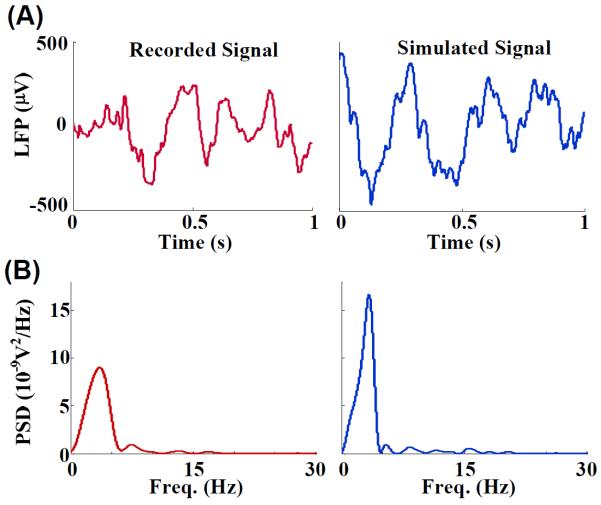
(A) Two example traces of LFPs. Left: LFPs recorded from the somatosensory cortex of an anesthetized rat (S1FL), sampled at 300 Hz. Right: LFPs simulated using a model network of five Hindmarsh-Rose neurons (see Fig. 1) subjected to frequency dependent attenuation [26]. (B) Power spectra for the two LFP signals. The similarity between the two signals in the time domain and the frequency domain resulted from a judicious choice of parameters in the model network. The simulated signals were used to characterize the GC interactions as a measure of coupling between two coupled model networks.

