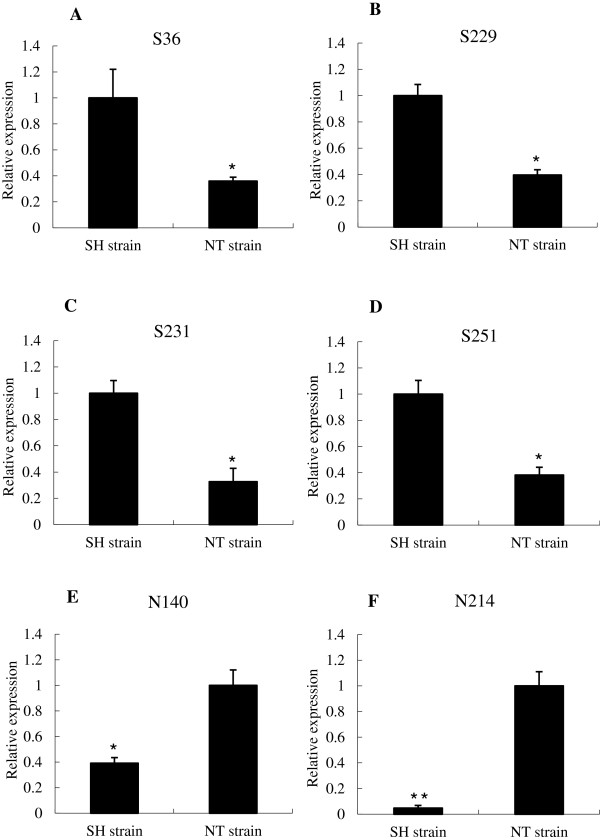
Figure 4.

Relative expression of sequences in SH and NT strain by qRT-PCR analysis. The results of the relative expression of S36, S229, S231, S251 were shown as A, B, C and D, N140 and N214 were shown as E and F. Each bar represents the mean ± S.D. value (n = 3). *, P < 0.05; **, P < 0.01.
