Figure 7.

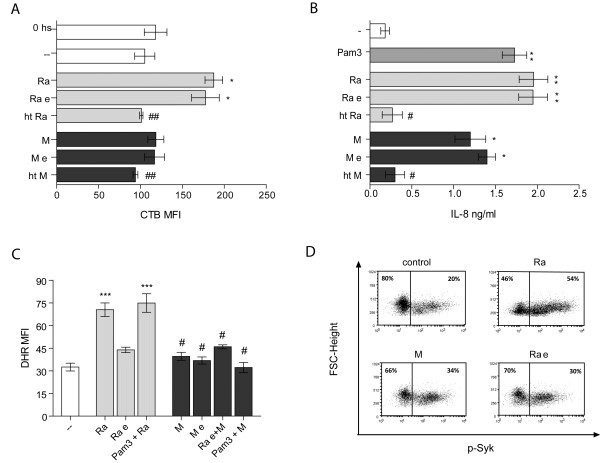
α-glucans are not involved in the expression of GM1, or in the secretion of IL-8. (A) PMN were cultured with Ra and M strains, enzimatically treated Mtb (Ra e, M e) or heat killed Mtb (ht Ra, ht M), in a 2:1 Mtb:PMN ratio. Thereafter cells were labeled with CTB-FITC and fluorescence evaluated by flow cytometry. Results are expressed as a mean ± SE (n = 12); control (−−) vs. Ra and Ra e: *p < 0.05; Ra and Ra e vs. ht Ra ##p < 0.01; M and M e vs. ht M: ##p < 0.01. (B) PMN were cultured for 18 hr at 1:2 Mtb:PMN ratio. Pam3Cys was used as control. IL-8 was measured in supernatant employing ELISA kits as described in Methods. Results are expressed as mean ± SE (n = 10); control (−−) vs. Ra, Ra e and Pam3Cys: **p < 0.01, control (−−) vs. M and M e: *p < 0.05; Ra and Ra e vs. ht Ra #p < 0.05; M and M e vs. ht M: #p < 0.05. (C) PMN incubated with DHR were cultured with enzimatically treated Ra (Ra e) or Pam3Cys and thereafter cells were challenged with M for additional 60 min (1:2 Mtb:PMN ratio). Emission of oxidized DHR was evaluated by flow cytometry. Results are expressed as a mean ± SE (n = 12); control vs. Ra or Pam3Cys + Ra: ***p < 0.001; Ra or Pam3Cys + Ra vs. Ra e, M, M e, Ra e + M or Pam3Cys + M: #p < 0.05. (D) Percentage of cells that express the activated form of Syk in PMN incubated with Ra, M or enzimatically treated Ra (Ra e) clinical strains. One representative experiment of 10 is depicted.
