
Figure 1.
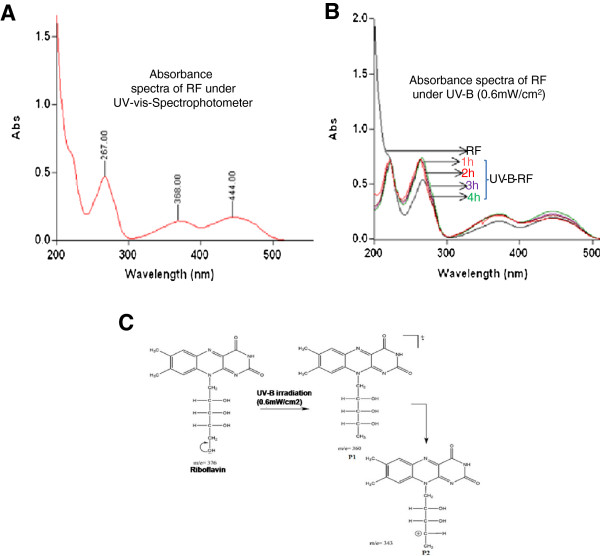
Absorbance spectra of RF under UV-B by UV–vis-Spectrophotometer. (A) Absorbance spectra of RF (5 μg/ml) showed maximum absorbance in UV-B region. (B) Absorbance spectra of UV-B-RF in different time interval (1 to 4 h) compared to RF. (C) Schematic representation of RF photodegradation and photoproducts ion formation under UV-B (0.6 mW/cm2 for 1 h) irradiation, identified by LC-MS/MS analysis. Representative data of three independent experiments.