Figure 3.

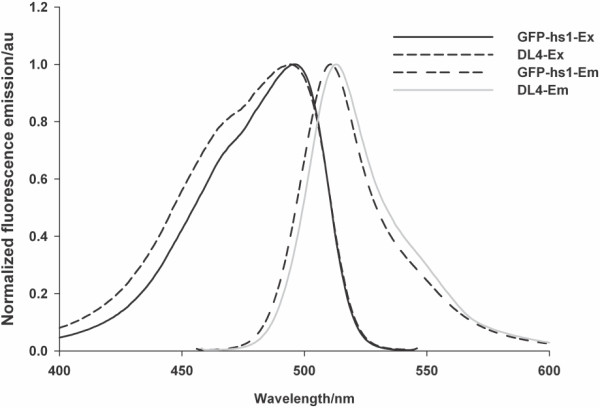
Excitation/emission spectra of GFP-hs1 and DL4. Protein samples were scanned for excitation (between 400 & 550 nm) and emission spectra (between 450 & 600 nm) using fluorescence spectrophotometer.

Excitation/emission spectra of GFP-hs1 and DL4. Protein samples were scanned for excitation (between 400 & 550 nm) and emission spectra (between 450 & 600 nm) using fluorescence spectrophotometer.