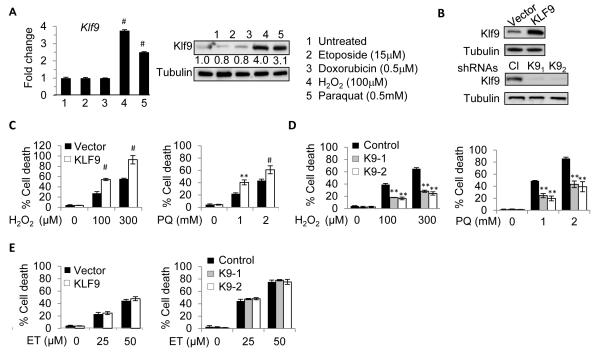
Figure 1. Klf9 is induced by oxidative stress and promotes oxidative stress-induced cell death.
(A) NIH3T3 cells were treated with indicated agents for 8 hours followed by immunoblot (left panels) and Q-RT-PCR (right panels) analysis. Numbers under Klf9 panel indicate fold induction of Klf9 signal (normalized by tubulin signal) compared to corresponding signals in untreated cells. (B) NIH3T3 cells were transduced with the indicated constructs followed by immunoblot analysis with indicated antibodies. Cl - control shRNA, K91 and K92 are Klf9 shRNAs. (C-E) Cells transduced as in (B) were treated as indicated for 16 hours followed by viability assay (trypan blue exclusion), PQ=paraquat, ET=etoposide. The data are presented as the mean values of triplicates ± S.E.M. p-values were determined by Student’s t-test. (*p<0.05), (**p<0.001), (#p<0.0001). Each experiment was performed at least two times with consistent results. See also Figure S1.

