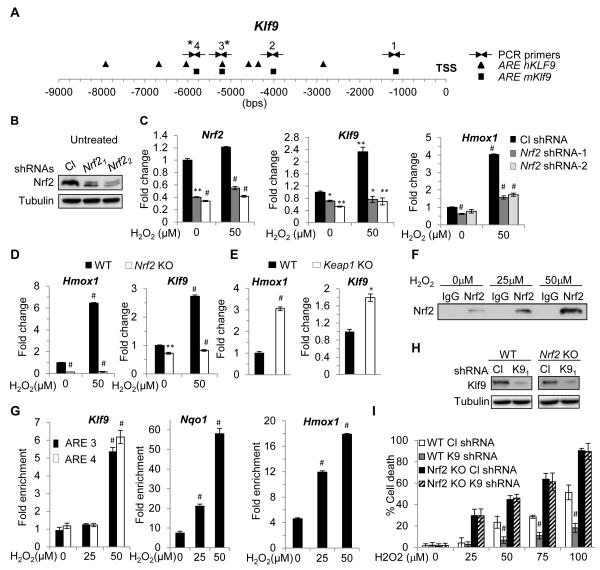
Figure 3. Nrf2 transcriptionally activates Klf9 in response to threshold levels of ROS.
(A) Schematic representation of human and mouse Klf9 promoters. Squares and triangles represent human and mouse Nrf2 binding sites (ARE), respectively. TSS-transcription start site. Arrows indicate PCR primers. (B) NIH 3T3 cells were transduced with control (Cl) or two Nrf2-specific shRNAs (Nrf21 or Nrf22) followed by immunoblotting analysis with indicated antibodies. (C) NIH3T3 cells transduced as in (B) were treated with indicated amounts of H2O2 for 2 hours followed by Q-RT-PCR analysis with indicated probes. (D) Wildtype (WT) or Nrf2 knock-out (Nrf2 KO) MEFs were treated with indicated amounts of H2O2 followed by Q-RT-PCR analysis with indicated probes. (E) WT or Keap1 knock-out (Keap1 KO) MEFs were analyzed using Q-RT-PCR for the expression of indicated genes. (F) NIH 3T3 cells were treated with indicated amounts of H2O2 for 2 hours. Cells were fixed and sheered cross-linked chromatin was prepared as detailed in the Extended Experimental Procedures. The chromatin was precipitated using control (IgG) or Nrf2-specific antibodies (Nrf2). A portion of the immunoprecipitate was probed in immunoblotting with Nrf2-specific antibodies. (G) DNA isolated from the precipitated materials described in (F) was analyzed in Q-PCR with indicated primers (see Extended Experimental Materials). The Hmox1-Nqo1- and Klf9-specific signals from Nrf2-precipitated DNA were normalized by those from IgG precipitated DNA. (H) Wildtype (WT) and Nrf2 knock-out (Nrf2 KO) MEFs were infected with control shRNA (Cl shRNA) or Klf9 shRNA1 (K9 shRNA). Two days post infection Klf9 expression was assessed in the cells by immunoblotting with indicated antibodies. (I) In parallel, cells were treated with indicated amounts of H2O2 and tested by trypan blue exclusion cell viability assay 16 hours after treatment. The data are presented as the mean values triplicates ± S.E.M. p-values were determined by Student’s t-test. (*p<0.05), (**p<0.001), (#p<0.0001). Each experiment was performed at least two times with consistent results. See also Figure S3.

