
Table 4.
Comparision between type 1 DM patients and control groups in 25-OHD level and vitamin D deficiency according to age
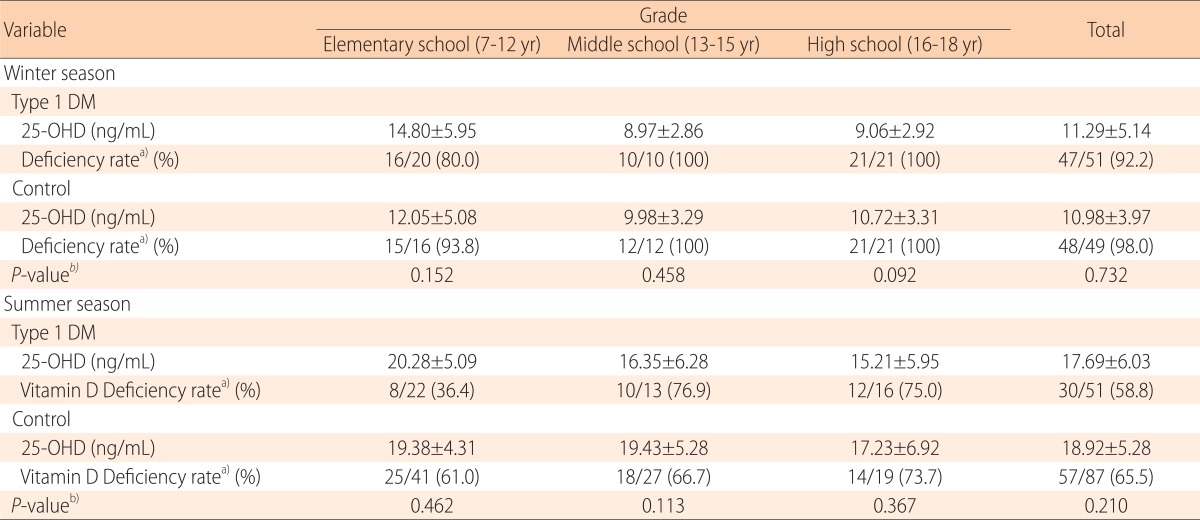
Values are presented as mean±standard deviation or number (%).
DM, diabetes mellitus; 25-OHD, 25-hydroxy vitamin D.
a)Percentage of serum 25-OHD level below 20 ng/mL in patients with type 1 DM. b)We compared about mean value of 25-OHD between type 1 DM and control. Statistical significances were tested by independent t-test.