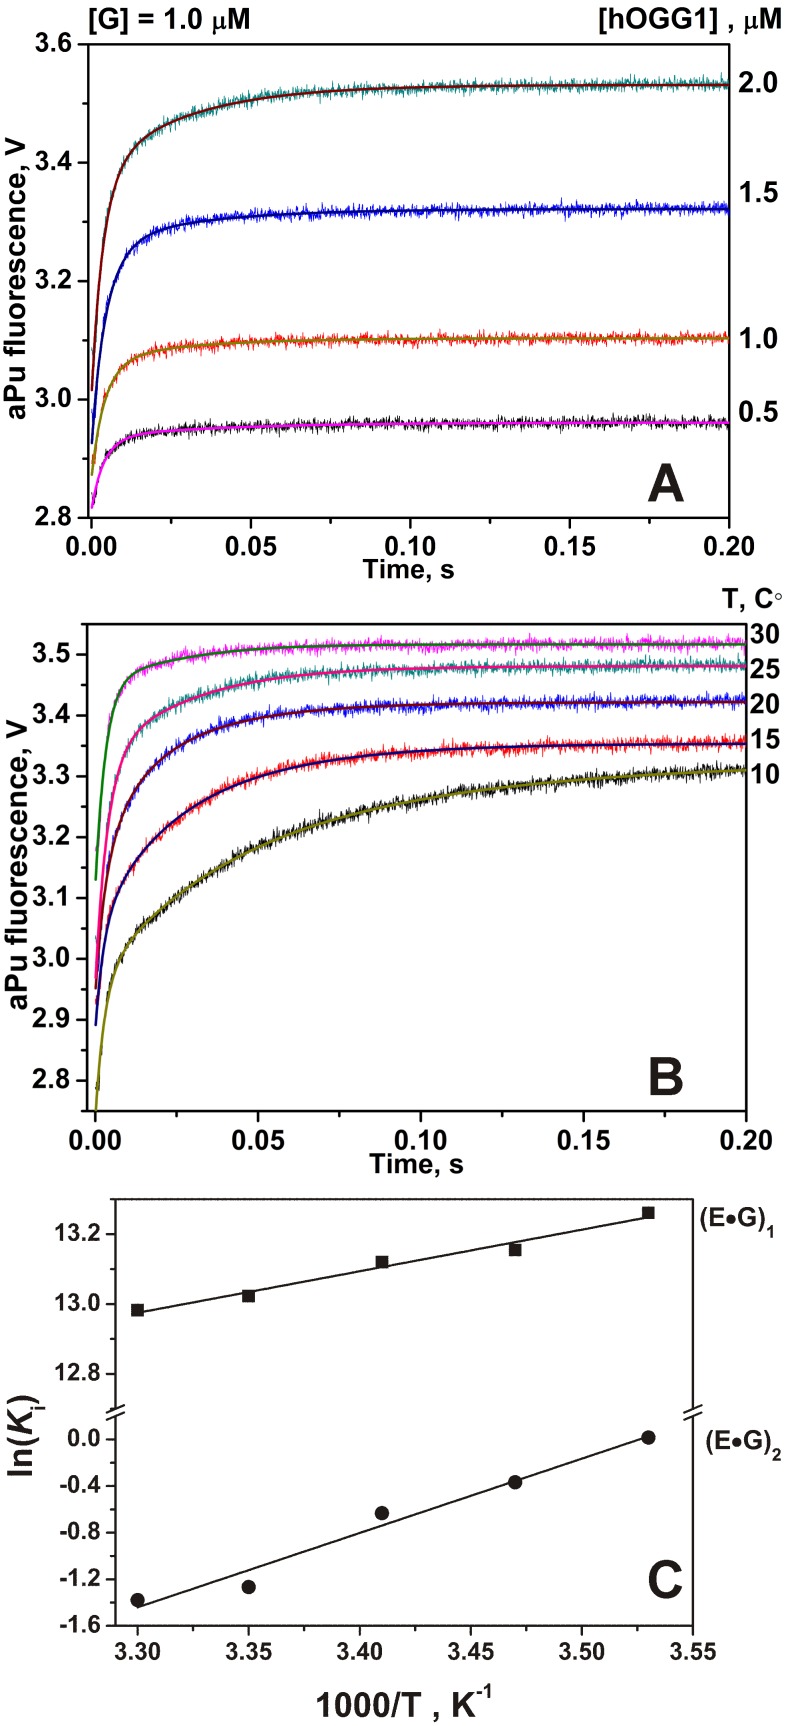
Figure 6. Stopped-flow fluorescence traces for interactions of hOGG1 with G-ligand.
Changes in aPu fluorescence intensity during interaction of hOGG1 with G-ligand at different concentrations of enzyme at 25°C (A) and at different temperatures (B). Solid lines represent the fitted curves. The concentrations of hOGG1 and G-ligand were 2.0 µM and 1.0 µM, respectively. (C) Van’t Hoff analysis of the temperature dependence of Ki for G-ligand.

