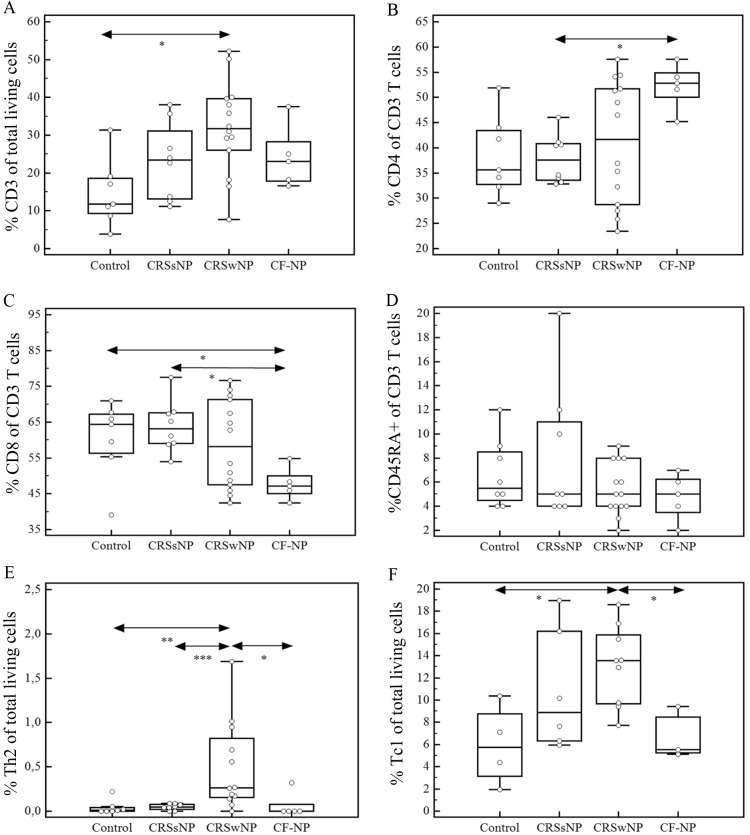
Figure 1. Flow cytometricanalyses of T cells in sinonasal mucosa.
Data are expressed in Box-Whisker-plots presenting the results of CD3+ T cells (a), CD4+ T cells (b), CD8+ T cells (c) and the proportion CD45RA+ within the CD3+ T cell population (d). Box-Whisker-plot presenting the results of the percentage of Th2 cells in the different disease groups (e). Percentage of Tc1 cells (IFNγ producing CD8 T cells) in healthy and diseased nasal mucosa are presented as a Box-Whisker-plot (f). Significance (p) values after Mann-Whitney U test are represented by: * when p<0,05, ** when p<0,01 and *** when p<0,005.

