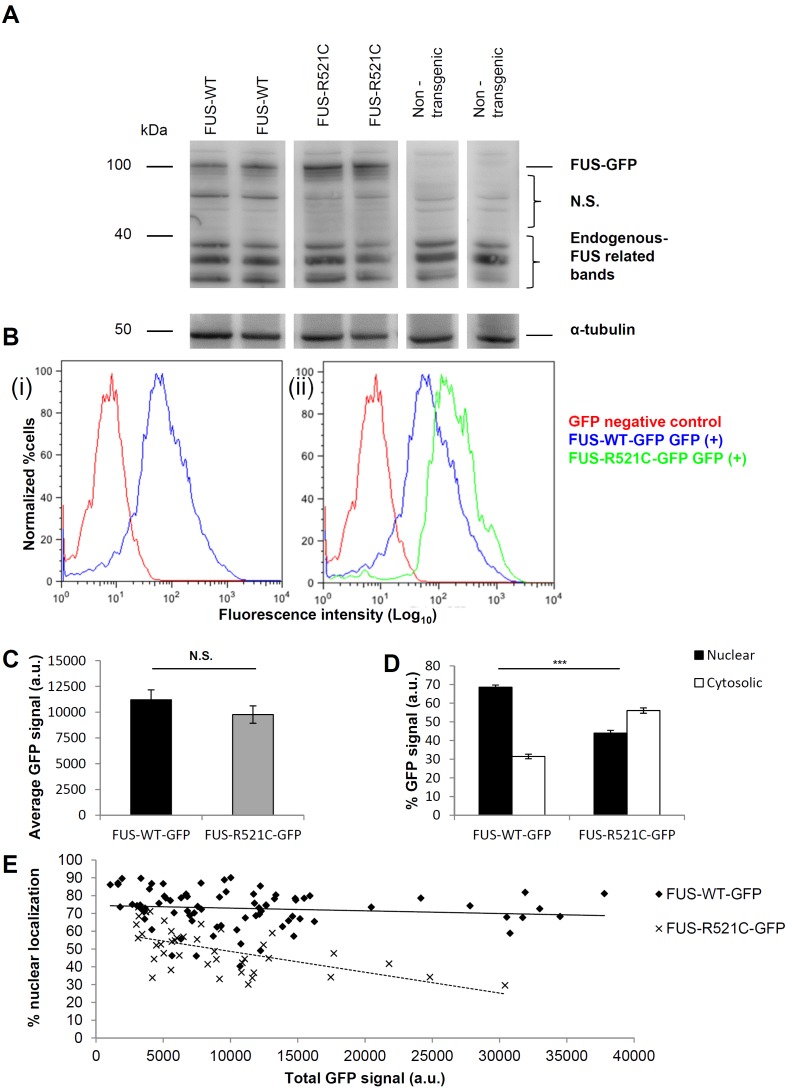
Figure 2. Universal cytosolic mislocalization of mutant FUS-GFP protein expressed in zebrafish cells.
(A) A band at ∼100 kDa was seen uniquely in transgenic lysates corresponding to full length human FUS (75 kDa) conjugated to GFP (25 kDa) but not non-transgenic lysates. Lower MW bands (∼30–40 kDa) consistent with endogenous FUS were detected in all including non-transgenic zebrafish lysates. Multiple bands for endogenous FUS may indicate some degradation. N.S. denotes non-specific bands. Alpha-tubulin was used as a loading control. (B) Flow cytometric analysis demonstrated GFP expression in dissociated transgenic larvae. Y-axis units are normalized to the number of cells analyzed (5000–10000 cells per sample) and GFP intensity readings are presented in a log scale on the x-axis. (i) Cell suspensions of GFP positive vs. GFP negative larvae siblings derived from human FUS-WT-GFP transgenic fish. Clear separation of cells positive and negative for GFP is shown by the GFP +ve peak on the right and the GFP –ve peak on the left. (ii) Mean GFP fluorescence per cell in fresh cell suspensions from FUS-R521C-GFP and FUS-WT-GFP lines. (C) There was no significant difference in total GFP intensity per cell between lines after plating and culturing cells. Error bars represent SE. (D) Quantification of GFP fluorescence (A.U.) in nucleus and cytosol in individual cells in cultures from each fish line (n = 50–100 cells) demonstrated that there was a significant elevation in cytosolic and reduction in nuclear GFP fluorescence in FUS-R521C-GFP compared to FUS-WT-GFP cells (post-hoc Tukey HSD. *** = P<0.001). (E) To address the question whether elevated levels of FUS fusion protein expression could in itself cause mislocalization, we measured the total GFP fluorescence intensity versus the % nuclear GFP fluorescence in 50 to 100 individual cells of each genotype. Data were collected from 3 independent experiments for each line. There was no significant correlation between level of total GFP expressed in a cell and its subcellular distribution based on the R2 values for each line (FUS-WT-GFP: R2 = 0.0145 and FUS-R521C-GFP: R2 = 0.3458) (n = 79 and 41 respectively).

