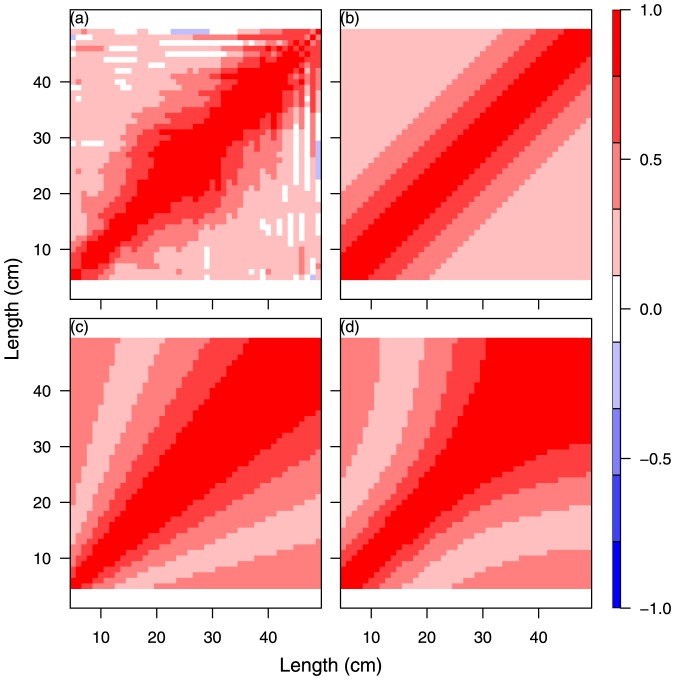
Figure 2. Comparison between fish size correlation matrix from different single-species model specifications for cod year 2009 quarter 4.
SS1, Unconstrained free size correlation structure given as a positive definite correlation matrix (a); SS2, natural untransformed scale (b); SS3, log scaled (c); SS4, logistic scaled (d).

