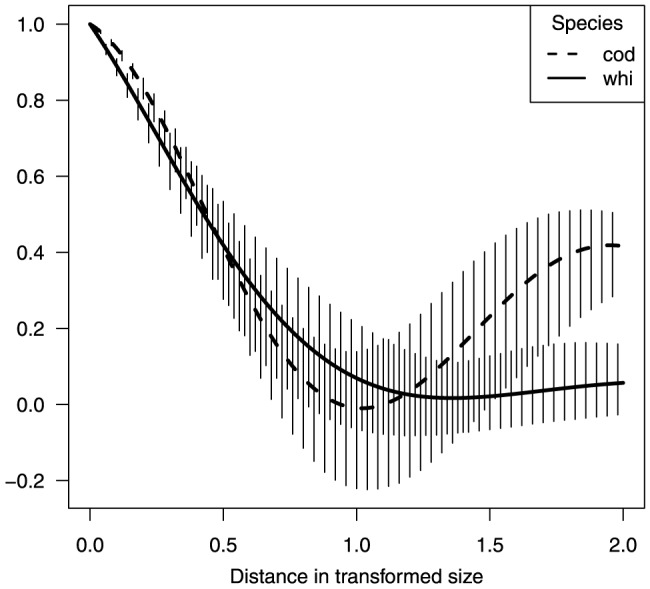
Figure 4. Estimated correlation (y-axis) for different size correlation functions, Eq. (5), of cod and whiting (single species runs) using the log transform model parameters given by Table 3.

The vertical bars indicate the 95% confidence intervals.

The vertical bars indicate the 95% confidence intervals.