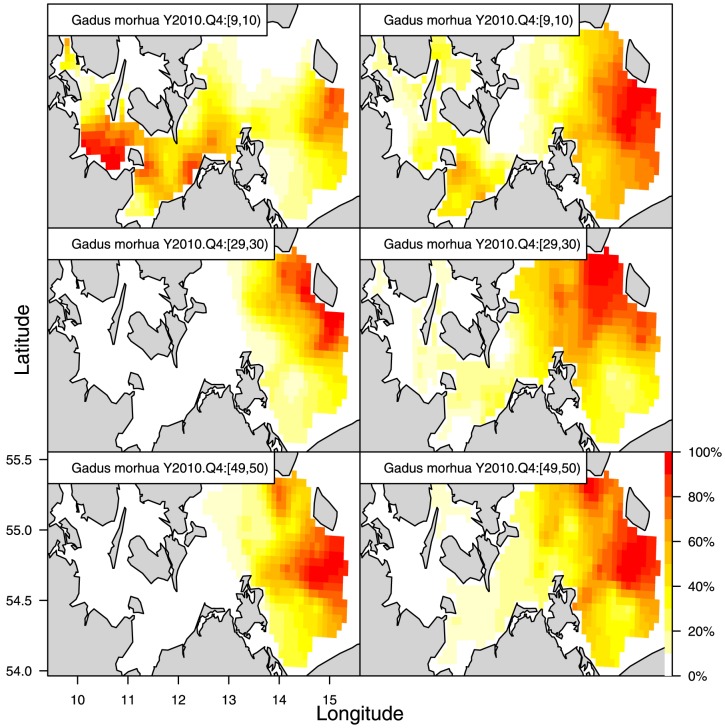
Figure 8. Predictive power of the models illustrated by maps of relative cod abundance 2010/Quarter 4 based on cod observations that year (left column) versus the same maps based on cod observations previous year (right column) utilizing model MY3.
The three row panels indicate three cod size groups in cm.

