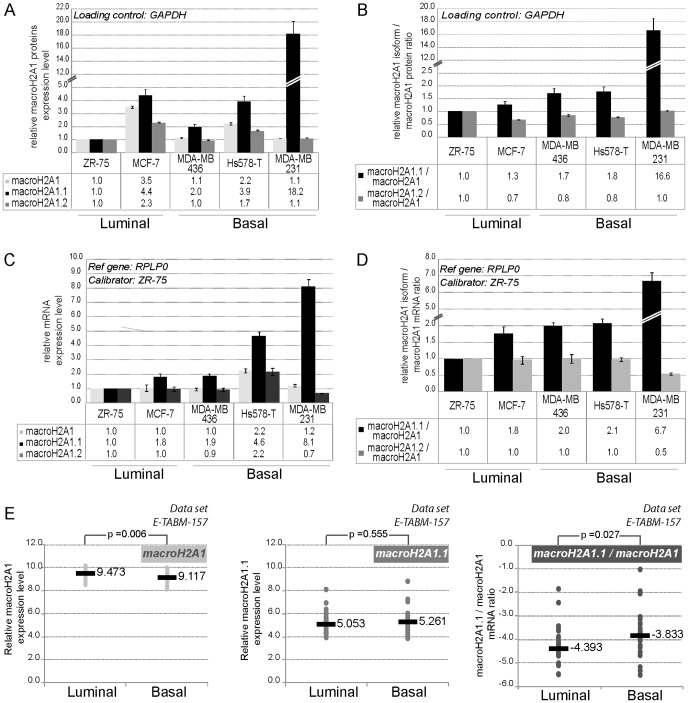
Figure 1. Expression levels of macroH2A1 splice variants in breast cancer cell lines.
A-B- MacroH2A1.1, macroH2A1.2, and total macroH2A1 protein expression levels in five breast cancer cell lines. Quantification of each macroH2A1 splice variants, global macroH2A1 (A) and macroH2A1.1/macroH2A1, macroH2A1.2/macroH2A1 ratios (B) for each cell line normalized to GADPH is shown relative to the ZR-75 cell line. C-D- qPCR analysis of mRNA expression levels of macroH2A1, macroH2A1.1, macroH2A1.2 and macroH2A1 splice variants/macroH2A1 mRNA ratio. Each quantification was performed at minimum in biological triplicate. Expression levels were normalized to expression of RPLP0, and referred to the cell line ZR-75 as a sample calibrator. E- Analysis of expression data of macroH2A1 variants in 51 breast cancer cell lines on the basis of U133A array hybridization [30]. Log2 macroH2A1, MacroH2A1.1 and macroH2A1.1/macroH2A1 values are determined and classified according to luminal or basal molecular subtype as defined in [30]. Data of DU4475, HCC1008 and HCC1599 are included in the analysis with the molecular subtype assigned in the synthesis part of Table S1. The median of each subgroup is shown (grey bar). The reported p-values are the results of a two-tailed Mann-Whitney test.

