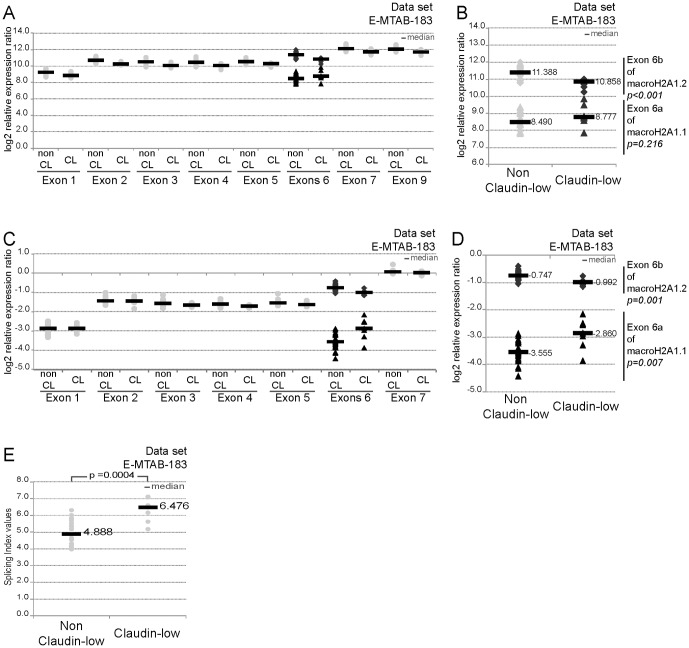
Figure 3. Analysis of expression data of macroH2A1 variants in breast cancer cell lines on the basis of Affymetrix Human Junction technology (E-MTAB-183[11]).
A- Log2 expression values of exons of H2AFY gene are represented by molecular subtype non claudin-low (non CL) and claudin-low (CL). The analysis for exons 6a/b are highlight in B. C- Log2 expression values of exons of H2AFY gene normalized to the one of exon 9 are represented by molecular subtype non claudin-low (non CL) and claudin-low (CL). The analysis for exons 6a/b are highlight in D. E- Splicing index values for exon 6a included in macroH2A1.1 splice variant are represented by molecular subtype. The median of each subgroup is shown (grey bar). The reported p-values are the results of a two-tailed Mann-Whitney test.

