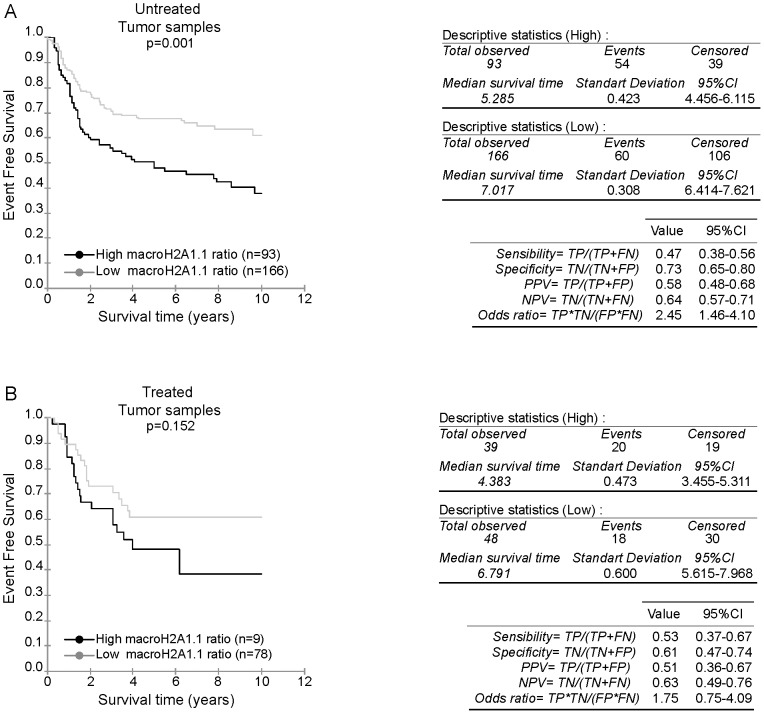
Figure 6. Kaplan Meier analysis according to the macroH2A1.1 mRNA ratio in untreated and treated sub-cohort.
A- The 259 TNBC untreated samples from the GSE31519 cohort were stratified according to the macroH2A1.1/macroH2A1 mRNA ratio. Kaplan Meier analysis of event free survival of 259 samples with follow up information is shown. PPV and NPV of macroH2A1.1/macroH2A1 mRNA ratio in the untreated cohort are specified. B- The 87 TNBC adjuvant chemotherapy treated samples from the GSE31519 cohort were stratified according to the highest macroH2A1.1/macroH2A1 mRNA ratio. Kaplan Meier analysis of event free survival of 87 samples with follow up information is shown. PPV and NPV of macroH2A1.1/macroH2A1 mRNA ratio in the treated cohort are specified.

