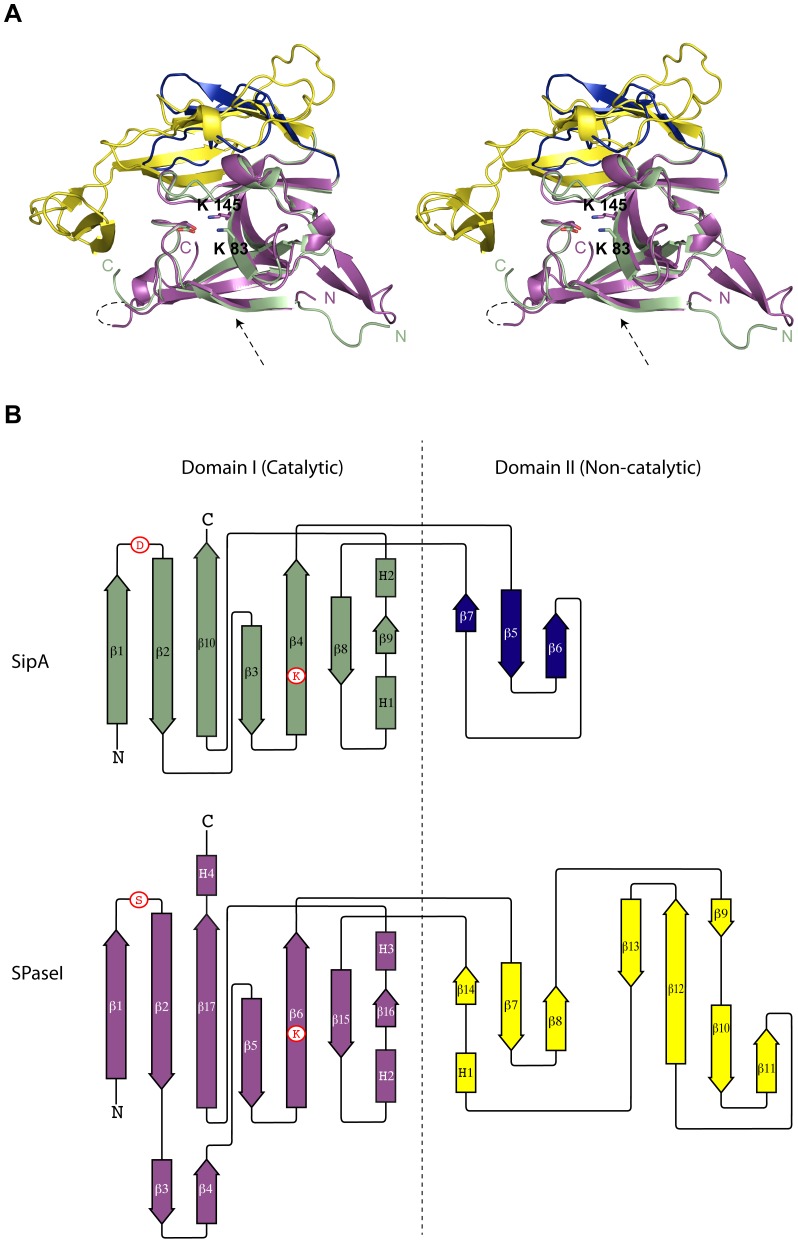
Figure 2. Comparison of SipA and E. coli SPase-I.
(A) Stereo-view of a structural alignment between the extracellular domains of SipA and SPase-I. The conserved catalytic core domain of SipA and SPase-I is shown in green and magenta, respectively, and the non-catalytic 'cap' domains in blue (SipA) and yellow (SPase-I). Shown in stick form are the SPase-I catalytic dyad residues (Ser 90 and Lys 145) and the corresponding residues in SipA (Asp 48 and Gly 85, and the nearby Lys 83). An arrow depicts the position of the peptide binding clefts. (B) Topology diagrams of SipA and E. coli SPase-I, color-coded as for the ribbon diagram. Dashed lines represent regions not visible in the electron density. The positions of key catalytic residues are shown in circles. N = N-terminus, C = C-terminus.

