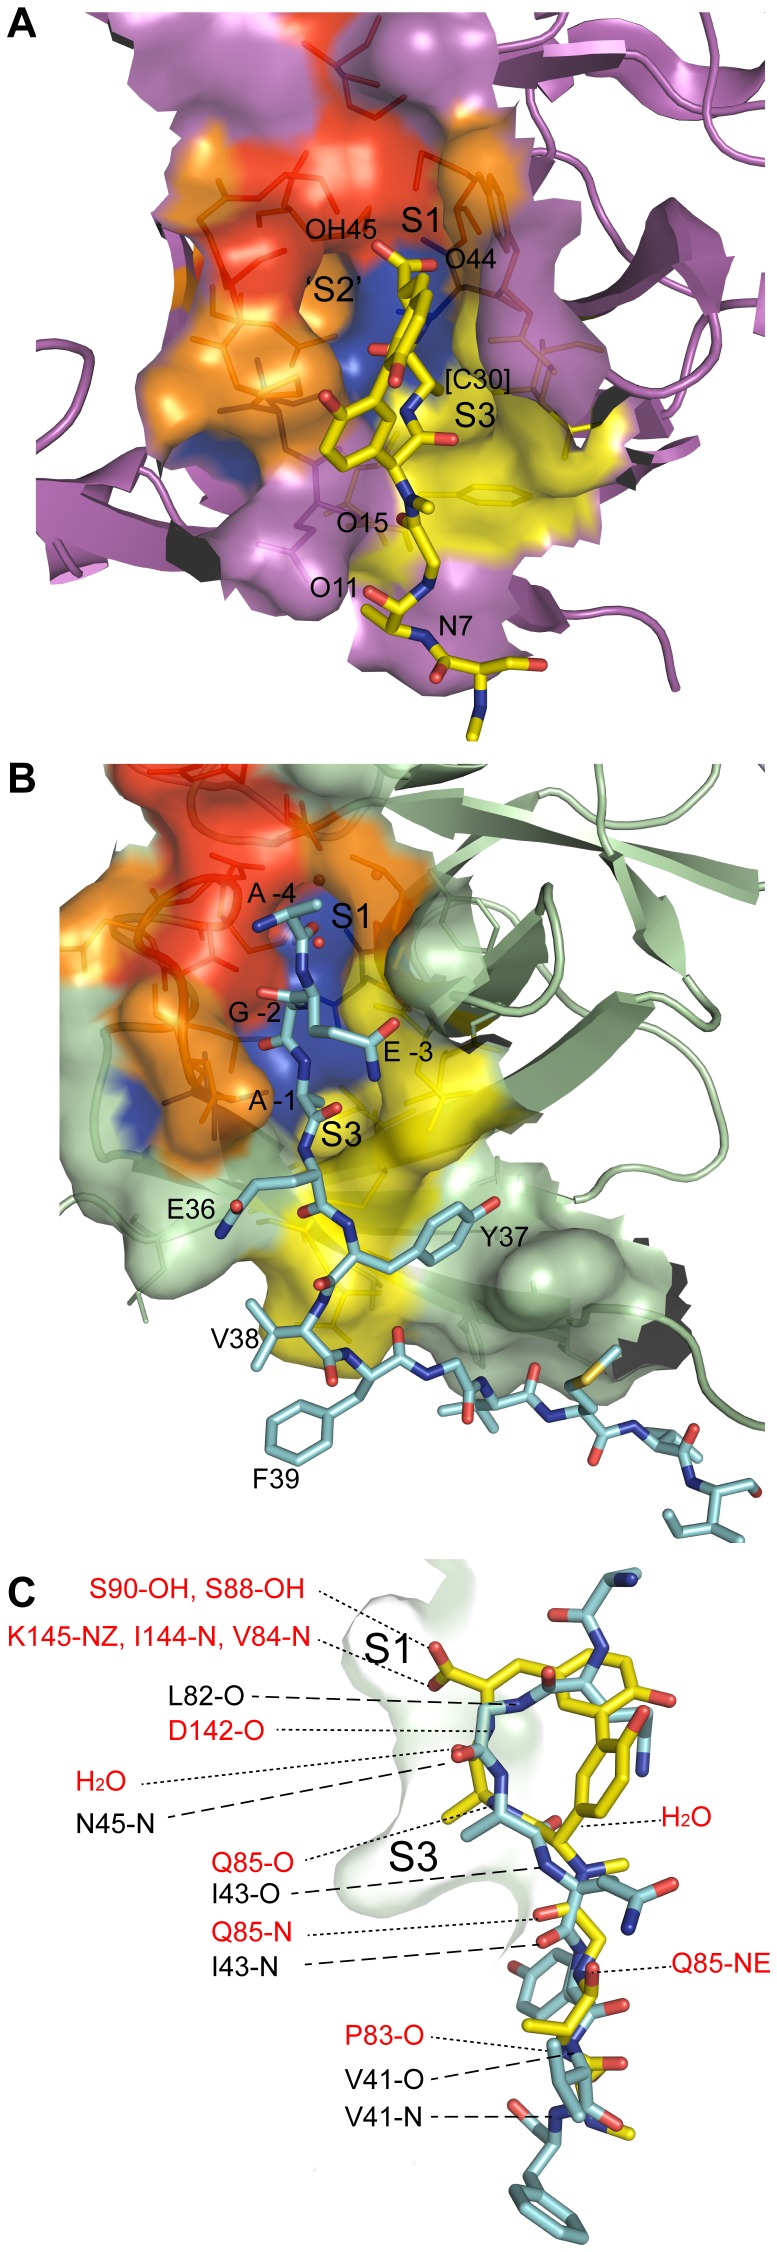
Figure 5. Comparison of the SipA and SPase-I substrate binding pockets.
Surface representation of the substrate binding pockets of (A) E. coli SPase-I (PDB ID, 3IIQ) and (B) SipA. The molecular surface is colored red for residues involved in the catalytic center of SPase-I and the corresponding residues in SipA; orange for residues contributing side chain atoms to the S1 and S2 pocket; yellow for those residues contributing side chain atoms to the S3 pocket; and purple for residues bridging the two pockets. The SipA A' peptide (cyan) and arylomycin (yellow) are shown in stick form bound to SipA and SPase-I, respectively. (C) Superposition of the active sites of SipA and SPase-I showing hydrogen bond interactions. SipA residues are listed in black with large dashes, and SPase-I residues are in red with small dashes. Homologous residues are grouped. A' peptide (Gly -2 to Phe 39, cyan) and arylomycin (fatty acid tail not included, yellow) are shown in stick form as a side view in the substrate binding pocket, colored by element (carbon, cyan or yellow; oxygen, red; nitrogen, blue). A surface representation of the SipA pocket showing the S1 and S3 pockets is in green.

