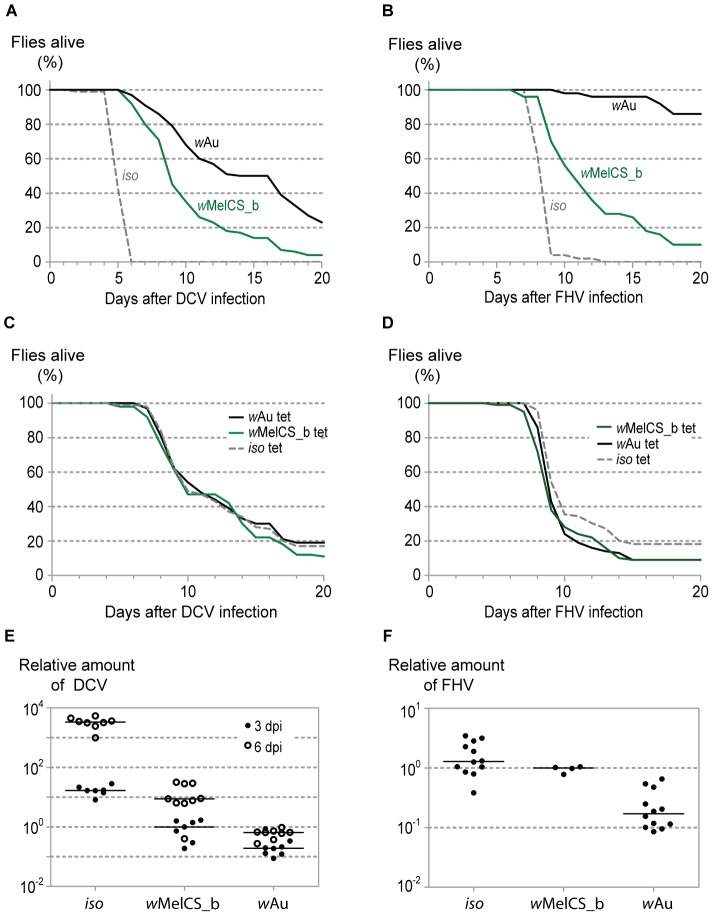
Figure 1. wAu provides more antiviral resistance than wMelCS_b in D. melanogaster.
(A) One hundred Wolbachia-free iso, wAu and wMelCS_b infected male flies were pricked with DCV (109 TCID50/ml) and survival was followed daily. This experiment was repeated twice and statistical analysis was performed on the data from all 3 repetitions (Figure S1A). (B) Fifty Wolbachia-free iso, wAu and wMelCS_b infected male flies were pricked with FHV (108 TCID50/ml) and survival was followed daily. This experiment was repeated and statistical analysis was performed on the data from both repetitions (Figure S1B). (C) One hundred males from wAu, wMelCS_b and iso tetracycline-treated lines were pricked with DCV (107 TCID50/ml) and survival was followed daily. This experiment was repeated and statistical analysis was performed on the data from both repetitions (Figure S1C). (D) One hundred males from wAu, wMelCS_b and iso tetracycline-treated stocks were pricked with FHV (108 TCID50/ml) and survival was followed daily. For data analysis see Figure S1D. (E) Wolbachia-free iso, wAu and wMelCS_b carrying male flies were pricked with DCV (109 TCID50/ml) and collected 3 and 6 days later for RNA extraction and RT-qPCR. Relative amounts of DCV were calculated using host Rpl32 mRNA as a reference and presented values are relative to median of wMelCS_b samples 3 dpi. Each point represents a replicate (ten males per replicate, 8 replicates per Drosophila line per time point), and lines are medians of the replicates. DCV loads are significantly different between the lines with wAu and wMelCS_b both 3 dpi (pairwise Wilcoxon rank sum test, p = 0.03) and 6 dpi (pairwise Wilcoxon rank sum test, p<0.001). (F) Wolbachia-free iso, wAu and wMelCS_b carrying male flies were pricked with FHV (109 TCID50/ml) and collected 3 days post infection for RNA extraction and RT-qPCR. Relative amount of virus were calculated using host Rpl32 mRNA as a reference and presented values are relative to median of wMelCS_b samples. Each point represents a replicate (ten males per replicate), and lines are medians of the replicates. FHV loads are significantly lower in flies with wAu comparing to flies with wMelCS_b (pairwise Wilcoxon rank sum test, p = 0.003).

