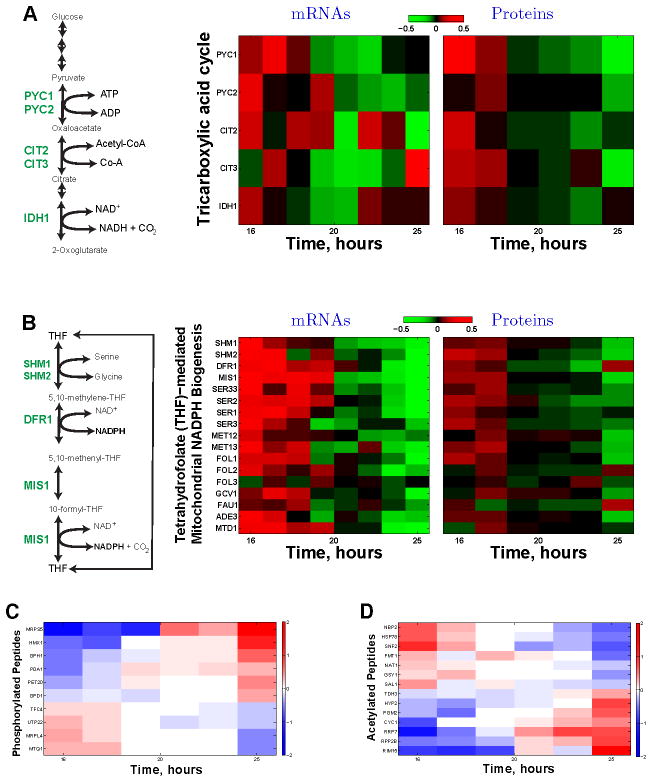
Figure 5. Dynamics of Enzymes and Post-translational Modifications Regulating Respiratory Metabolism at a Constant Growth Rate.
(A) The levels of enzymes (and their corresponding mRNAs) catalyzing the first rate-determining reactions of the tricarboxylic acid (TCA) cycle decline, parallel to the decreased oxygen consumption (Figure 2F), during the first exponential growth phase. These enzymes include the pyruvate carboxylases (Pyc1p and Pyc2p), citrate synthetases (Cit1p and Cit2p), and the isocitrate dehydrogenase (Idh1p). See Figure 4 and Figure S4 for other related pathways that also show statistically significant declines. The data are displayed on a log2 scale with 2 fold dynamical range.
(B) The levels of enzymes (and their corresponding mRNAs) catalyzing the tetrahydrofolate (THF)-mediated mitochondrial NADPH biogenesis decline, parallel to the decreased oxygen consumption (Figure 2F), during the first exponential growth phase. These include all enzymes (Ser3p, Ser33p, Ser1p, Ser2p) catalyzing the serine biosynthesis from 3-phosphoglycerate, the hydroxymethyltransferases (Shm1p, Shm2p) and the mitochondrial NADPH synthetases: the dihydrofolate reductase (Dfr1p) and the mitochondrial C1–tetrahydrofolate synthase (Mis1p). See Figure 4 and Figure S4 for other related pathways that also show statistically significant declines. The data are displayed on a log2 scale with 2 fold dynamical range.
(C) Levels of phosphorylated peptides change during exponential growth at a constant rate.
(D) Levels of acetylated peptides change during exponential growth at a constant rate. The levels of peptides with post-translational modifications are shown on a log2 scale, and the corresponding proteins are marked on the y–axis.
See also Figure S5.

