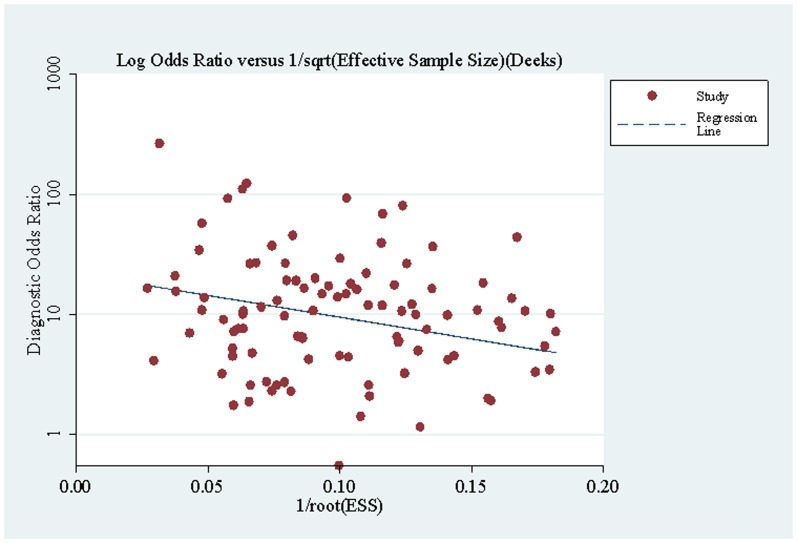
Figure 2. Funnel plot for the assessment of potential bias in s-p53 antibody assays.
The funnel graph plots the DOR (diagnostic odds ratio) against the 1/root (effective sample size). The dotted line is the regression line. The result of the test for publication bias showed publication bias (p<0.001).

