
Figure 9. Correlation between cell area and cell axis ratio in a constructed 2D geometry space.
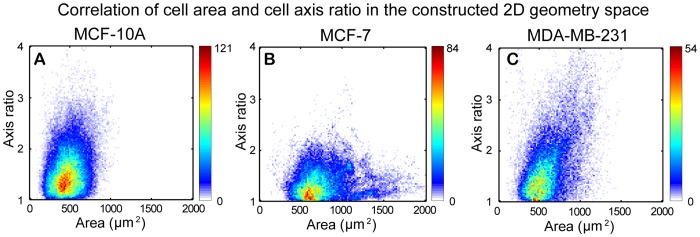
For any point in the 2D space, the x coordinate and the y coordinate represent cell area and cell axis ratio of a given cell at each video frame, respectively. Summation of all entry data in the 2D space for all video frames results in the overall 2D geometry distribution maps. The frequency of cells appears at each point in the 2D space is indicated with corresponding color bar. (A) MCF-10A cells have a narrow distribution of cell area, while (B) MCF-7 cells show a wider distribution of cell area. (C) MDA-MB-231 cells have a wider distribution of axis ratio. Moreover, the axis ratio for MDA-MB-231 cells slightly increases with increasing cell areas.