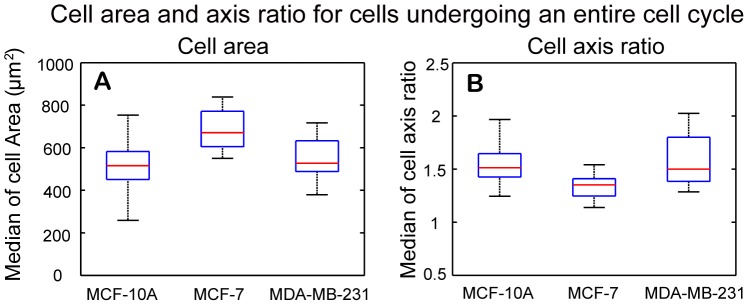
Figure 11. Boxplots of median cell area and median cell axis ratio for cells undergoing an entire cell cycle.

(A) MCF-7 cells have highest median value of cell area, while the median value for MDA-MB-231 cells is slightly larger than that for MCF-10A cells. The Wilcoxon rank sum test showed that there is statistically significant difference in distribution shift of median cell areas between MCF-10A and MCF-7, and between MDA-MB-231 and MCF-7 cells. (B) MDA-MB-231 cells have the highest median value of cell axis ratio followed by MCF-10A cells. MCF-7 cells have the lowest median value of cell axis ratio among the three cell lines. The Wilcoxon rank rum test showed that there is statistically significant difference in distribution shift of median cell axis ratios between MCF-10A and MCF-7, and between MDA-MB-231 and MCF-7 cells.
