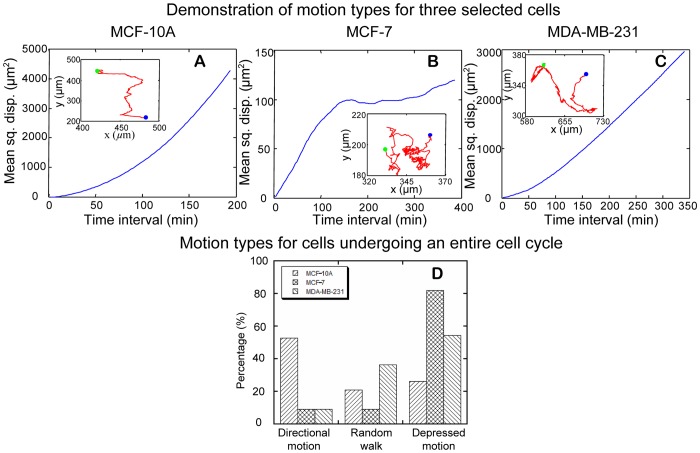
Figure 13. Motion types for cells undergoing an entire cell cycle.
(A–C) show mean square displacement (MSD) as a function of time interval for a cell of MCF-10A, MCF-7, and MDA-MB-231, respectively. From left to right, the MSD curves show directional motion, depressed motion, and random walk, respectively. The inset in each figure is cell trajectories during the entire cell cycle for the selected cell. Blue and green dots represent the starting and ending points along cell trajectories, respectively. (D) Motion types for MCF-10A, MCF-7, and MDA-MB-231 cells undergoing an entire cell cycle. For MCF-10A cells (N = 128), over 50% of cells examined belong to directional motion. For MCF-7 cells (N = 11), over 80% of cells examined belong to depressed motion. For MDA-MB-231 cells (N = 11), 54.5% of cells examined are depressed motion. Fisher's Exact test indicates that motion types are significantly different among the three cell-lines (p-value = 0.0001413).

