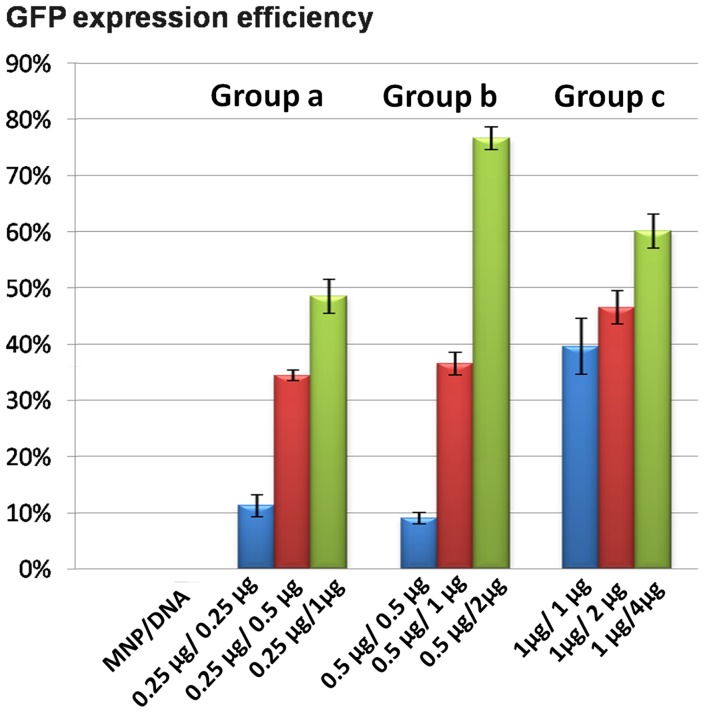
Figure 8. Dose–response relationships of GFP expression in PK15 cells with time.
Group a: 106 cells treated with 0.25 µg MNPs with MNP/DNA mass ratio of 1∶1, 1∶2, 1∶4 respectively. Group b: 106 cells cells treated with 0.5 µg MNPs with MNP/DNA mass ratio of 1∶1, 1∶2, and 1∶4 respectively. Group c: 106 cells treated with 1 µg MNPs with MNP/DNA mass ratio of 1∶1, 1∶2, and 1∶4 respectively.

