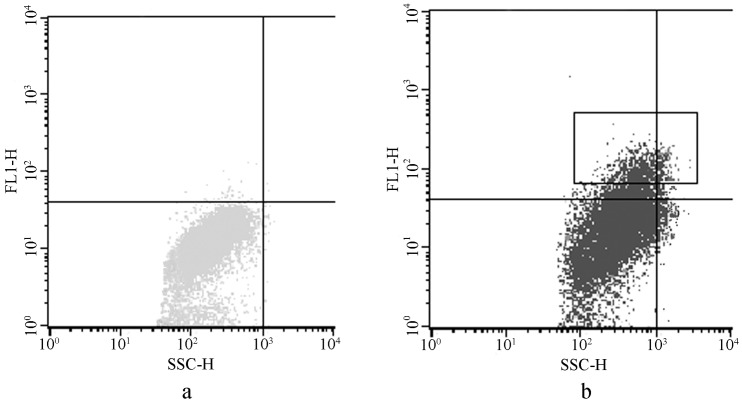
Figure 4. Quantitative comparison fluorescence variant between cells of the negative controls and the transformed lines.
The axis FL1-H means relative intensity of GFP florescence, and the axis SSC-H means side scatter of each alga cell. Fig. 4a, Fluorescence intensity of the negative cells. Fig. 4b, Fluorescence intensity of the transformed cells. The cells with higher fluoresce intension in the rectangle in Fig. 4b, were harvested for further LSCM scanning for GFP positive cells. These cells may contain wild type cells, cells with plasmids inserted into chromosomes, and cells with plasmids inserted in chloroplast genome.

