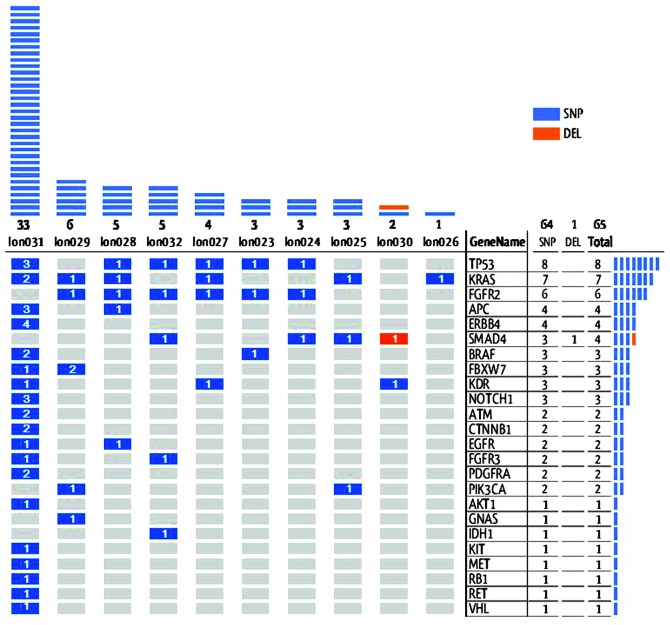
Figure 1.
Overall gene alteration patterns for 24 target genes in 10 samples. The blue bars represent SNPs whereas the red bars represent DELs. The numbers inside the bars show the alteration number and the upper columns show the number of alterations in each sample. Sample 31 exhibited the maximum number of 33 alterations, whereas sample 1 only exhibited one alteration. The right columns show the number of alterations in each gene; TP53 exhibited the maximum number of eight alterations, whereas eight genes, including AKT1, GNAS and IDH1, only exhibited one. SNPs, single nucelotide polymorphisms, DEL, deletion; PI3K, phosphoinositide 3-kinase.

