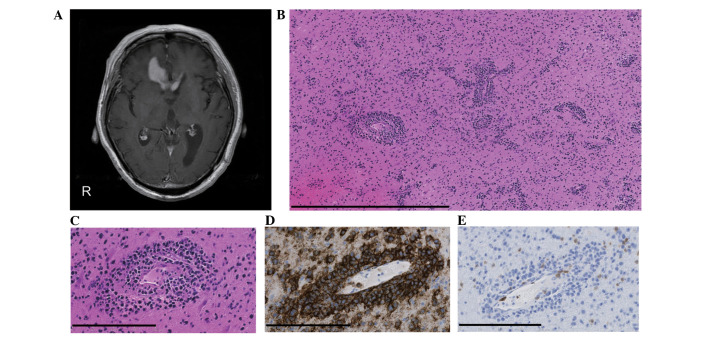
Figure 2.
Axial images obtained by brain magnetic resonance imaging and the histopathological findings of the tumor specimen obtained during the second biopsy. (A) Contrast-enhanced T1-weighted image shows new abnormal lesions in the right frontal lobe three months after the initial biopsy. (B,C) Histopathological examination of the specimen shows diffuse infiltrating atypical lymphocytes with perivascular aggregation (hematoxylin and eosin staining). (D) The majority of tumor cells expressed cluster of differentiation (CD) 20. (E) However, the tumor cells were negative for T-cell antibody and CD3. Scale bar: (B) 800 μm and (C–E) 200 μm.

