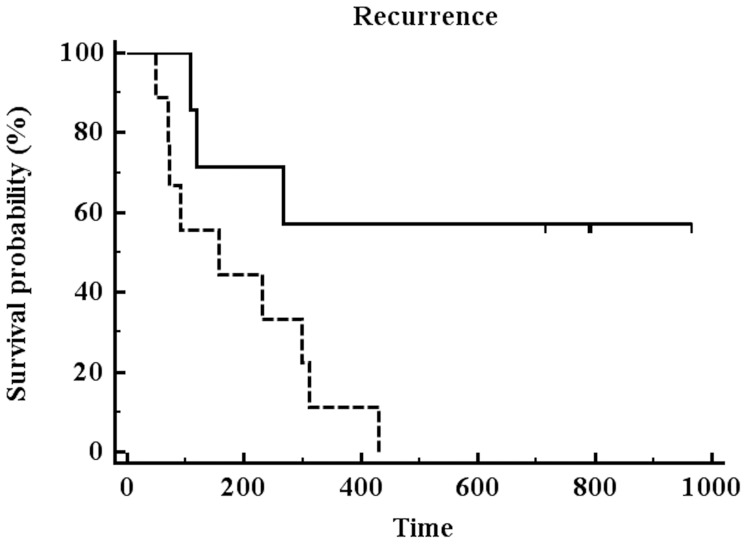
Figure 5. Kaplan-Meier survival curve analysis for patients with low-perfused (continuous line) or high-perfused (dashed line) gliomas (stratified according to the optimal mTBF cut-off value) after total tumor resection.
Patients with low-perfused gliomas had significantly longer EFS compared to patients with high-perfused gliomas (P = 0.0046).

