
Figure 5. Forest plot of observational studies comparing women with and without breast cancer for HOMA-IR levels.
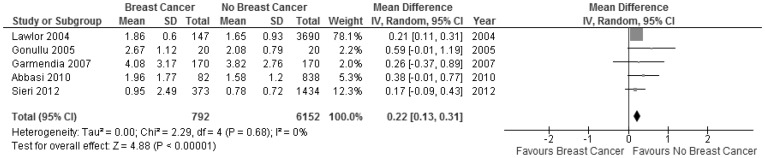
(IV, Random = Inverse variance, Random effects model.)
Official websites use .gov
A
.gov website belongs to an official
government organization in the United States.
Secure .gov websites use HTTPS
A lock (
) or https:// means you've safely
connected to the .gov website. Share sensitive
information only on official, secure websites.
(IV, Random = Inverse variance, Random effects model.)