
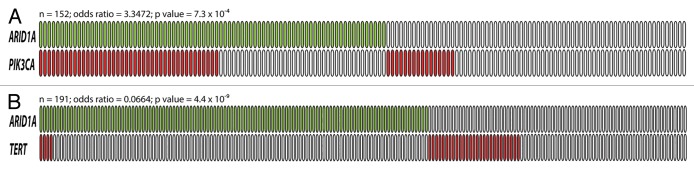
Figure 2. The relationship between ARID1A mutation and PIK3CA mutation (A), and between ARID1A mutation and TERT promoter mutation (B). Green boxes are tumors harboring somatic ARID1A mutations while red boxes are tumors with either PIK3CA mutation or TERT promoter mutation. Each box represents an individual tumor. The total number of tumors, the odds ratio (OR) and P values are shown above each diagram.