
Figure 1. HFD-fed mice are obese and glucose intolerant.
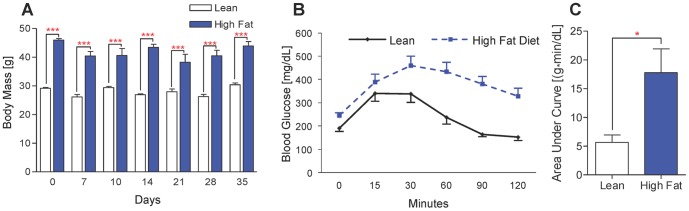
(A) Body weights of HFD-fed and control lean diet-fed mice at various time points after surgical fracture. Bars represent means ± SEM (n≥5). ***p<0.001 using a two-way, unpaired ANOVA with a Bonferroni post-test. (B) Glucose tolerance testing (GTT) was performed immediately prior to fracture on lean and HFD-fed mice. Plotted data points represent means ± SEM (n = 5). (C) Net area under the curve (AUC) was calculated for each mouse that underwent GTT (n = 5). *p<0.05 compared to respective lean diet controls using an unpaired, two-tailed Student's t test. Bars represent means ± SEM (n = 5).