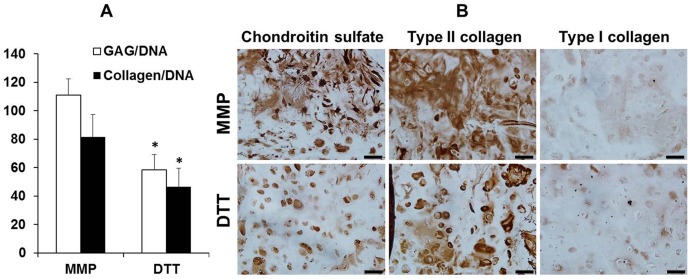
Figure 5. The analysis of the cartilaginous matrix contents of the hMSC-seeded hydrogels.
GAG and collagen content (normalized to the DNA content) of hMSC-laden HA hydrogels (A) and immunohistochemistry staining of the hydrogel constructs against chondroitin sulfate, type II and I collagen after 28 days of culture (B), Bar = 50 µm, *p<0.05 vs. MMP group (n = 4).

