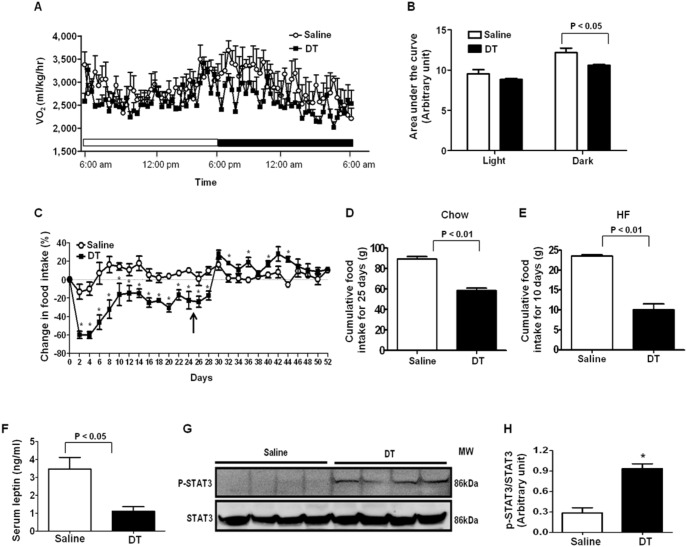
Figure 3. Macrophage depletion suppresses energy expenditure and food intake.
The energy expenditure of male LysMCre/iDTR mice was assessed using metabolic cages 6 days after saline or DT injection. (A) O2 consumption during the light and dark cycle (n = 4/each group) (B) Area under the curve of O2 consumption during the light and dark cycle (C) Food intake was measured every other day at 10 am during saline or DT injection. Injection was stopped at day 25, which is indicated by arrows. Cumulative food intake of (D) chow-fed (n = 5/group) or (E) HF-fed mice (n = 3/group) treated with saline or DT (F) Serum concentration of leptin (n = 5/group) was measured using ELISA kit after overnight fasting. (G) Phosphorylation of STAT3 protein was measured by Western blotting. (H) Quantified values of p-STAT3/STAT3. Data are represented as mean ± SEM. Asterisks denote significant differences *P<0.05 vs. saline-treated mice.

