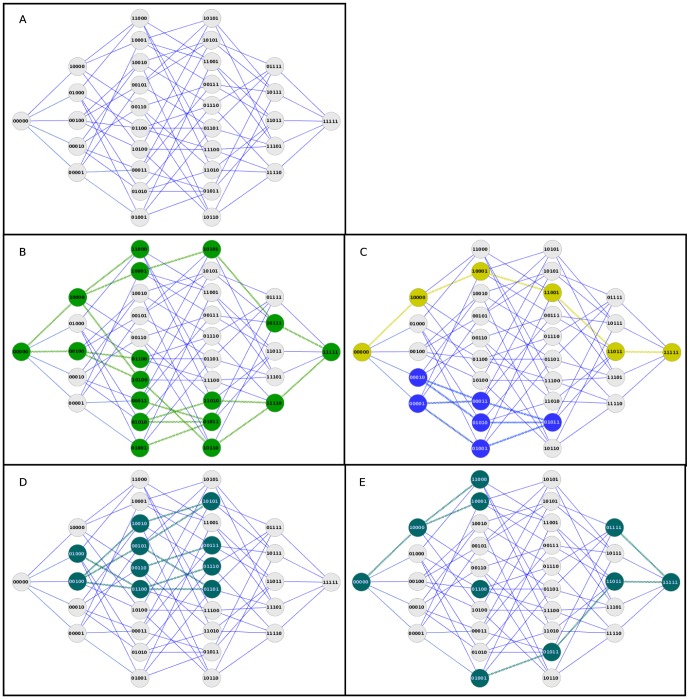
Figure 1. Examples of genotype networks and their properties.
A. Representation of the Genotype Space for a region including 5 loci or Single Nucleotide Variants (SNVs). The space of all possible genotypes is represented as a Hamming graph (whole network). Each node represents one possible genotype, and each edge represents that the two nodes connected have only one difference. B. Example of genotype network. On top of the Genotype Space, we mark the genotypes observed in a population, and define it as the genotype network of that population (green nodes). C. Genotype networks of two populations (yellow and blue). The green population has a large average path length and diameter, while the blue population has a short average path length and diameter. D. Genotype network of a population having a high average degree and only one single component. E. Genotype network of a population having low average degree and many fragmented components.

