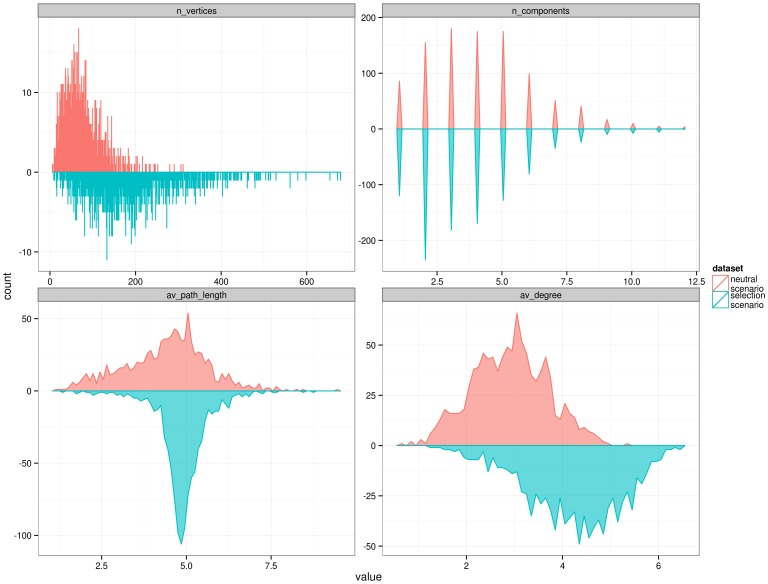
Figure 5. Distribution of network properties, comparing a dataset of neutral demography simulations against a scenario of selective sweep.
Selection scenario simulates a recent selective sweep with a selection coefficient of 0.015, and a final frequency of 0.99. The networks included in this graph are calculated by merging the 5,000 haplotypes of the three populations simulated (African + European + Asians) into a global population, and calculating the genotype networks on all the 15,000 haplotypes together.

