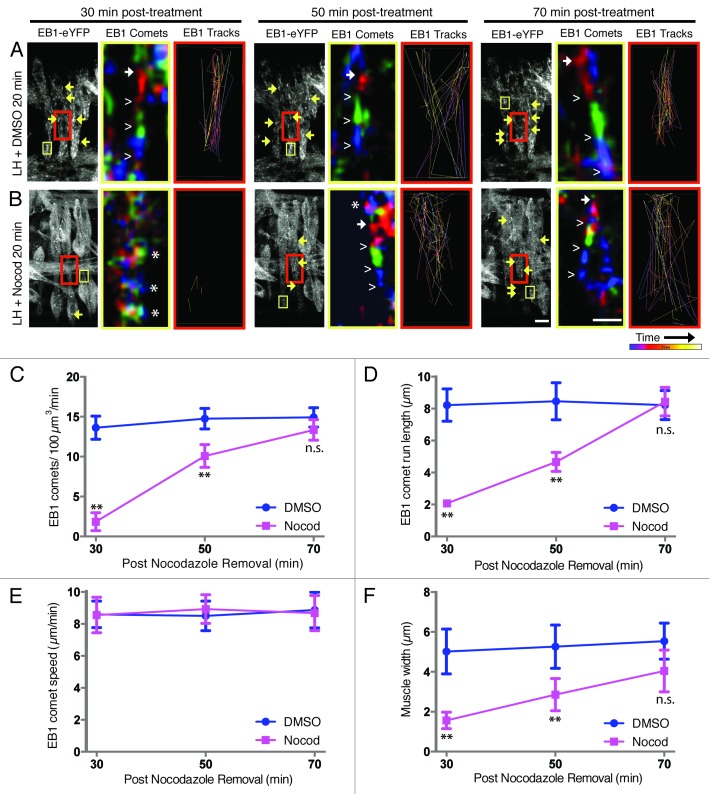
Figure 4. Restoration of the microtubule network can be observed in LH-treated embryos using time-lapse imaging. (A and B, left panel of each triplet) Still frames from Z-projections of 5 min movies taken of live embryos expressing EB1-eYFP at each of three time points: 30, 50, and 70 min post-treatment with LH for 20 min. Arrows highlight selected EB1 comets. Scale bar, 10 μm. Yellow boxes denote the region of muscle used to follow single EB1 comets over time, pseudocolored in the adjacent image. Red boxes indicate the region of the muscle used to monitor multiple EB1 comets traveling over time through a single Z-plane from within the LT muscle only, generating the adjoining image to the right. (Middle panel of each triplet) High magnification image sequences of traveling EB1 comets summed, pseudocolored according to time, and merged into one image. Red highlights the location of EB1-eYFP in frames 1–3 of the movie, green corresponds to frames 4–6, and blue identifies frames 7–9. Solid arrows denote the beginning of a comet, and open carets follow the path of the comet. Asterisks identify regions where all three colors are present in the same location, indicating the absence of EB1 comets. Scale bar, 1 μm. (Right panel of each triplet) Paths of traveling EB1 comets followed over time with Imaris tracking software. Purple tracks were recorded near the beginning of each movie. Yellow-white tracks were recorded toward the end of each movie. (A) DMSO vehicle controls in LH with defined EB1 comets. (B) LH supplemented with 66 nM Nocodazole in DMSO, showing little evidence of EB1 comets until 50–70 min post-treatment. (C) Quantification of the number of EB1 comets detected within the muscles in each treatment condition, indicating the number of growing microtubules. (D) Quantification of the run length of EB1 comets in each treatment condition, indicating the persistence of individual growing microtubules. (E) Quantification of EB1 comet speed in each treatment condition, indicating the rate of microtubule polymerization. (F) Quantification of the width of the center portion of the LT muscles in each treatment condition. For (C–F): n.s., not significant; ** indicates p <0.01.

An official website of the United States government
Here's how you know
Official websites use .gov
A
.gov website belongs to an official
government organization in the United States.
Secure .gov websites use HTTPS
A lock (
) or https:// means you've safely
connected to the .gov website. Share sensitive
information only on official, secure websites.
