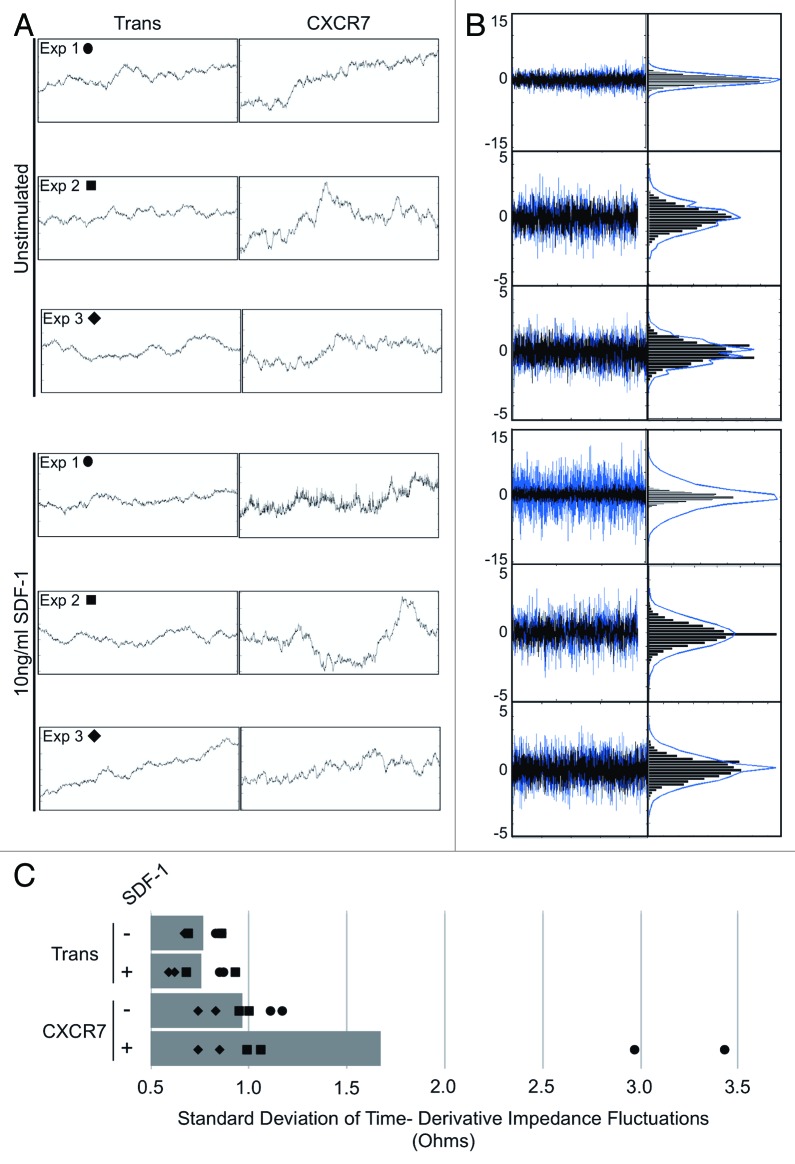
Figure 4. CXCR7+ EC display increased micromotion by ECIS. (A) Extracted impedance readings from ECIS traces scaled to 2 h by 100 ohms. Curves shown are impedance traces of pLEC infected with Trans or Trans+CXCR7 and treated with media only (Unstimulated, top 3 panels) or 10 ng/ml SDF-1/CXCL12 (bottom three panels). Symbols indicated for each experiment correspond to the data points shown in (C). (B) Overlayed time differential (left) and binned histograms of time differential data (right) for Trans (black, overlayed) and Trans+CXCR7 (blue, underlayed) corresponding to the same panels in (A). (C) Quantitation of the standard deviation of impedance fluctuations in Trans or Trans+CXCR7 cultures with or without 10 ng/ml SDF-1/CXCL12. Analysis includes duplicate wells from three independent experiments (black data points) and the average for each condition (gray bar).

An official website of the United States government
Here's how you know
Official websites use .gov
A
.gov website belongs to an official
government organization in the United States.
Secure .gov websites use HTTPS
A lock (
) or https:// means you've safely
connected to the .gov website. Share sensitive
information only on official, secure websites.
