


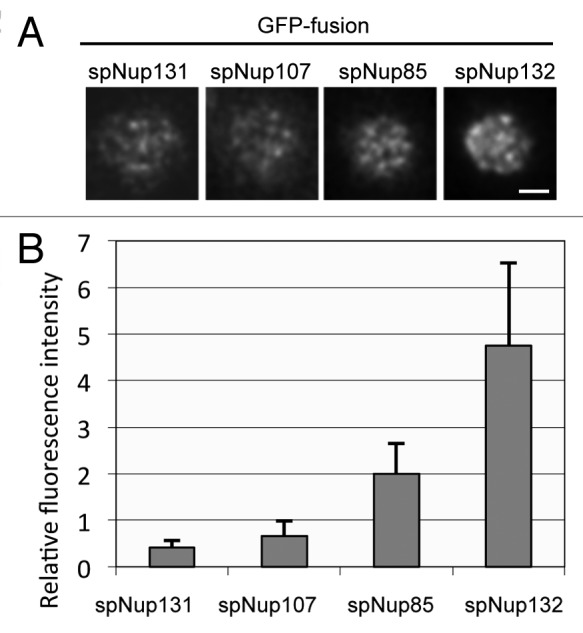
Figure 3. Fluorescence intensities of GFP-tagged nucleoporins measured by HILO microscopy. (A) HILO microscopy images of cells expressing spNup131-GFP, spNup107-GFP, spNup85-GFP, and spNup132-GFP. The nuclear region of a single cell is shown. The scale bar indicates 1 μm. (B) Fluorescence intensity of nucleoporins in single NPCs. Average and standard deviation are shown.