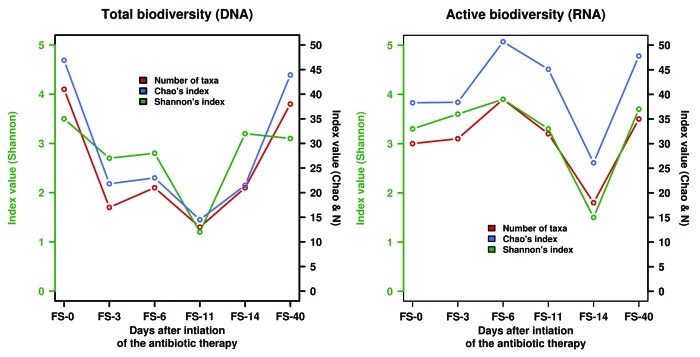
Figure 1. Biodiversity measurements of the total (left) and active (right) GIT microbiota from a patient receiving β-lactam therapy. The number of observed taxa (N), the biodiversity index value (Shannon), and the richness estimator (Chao1) are adapted from reference 30.

An official website of the United States government
Here's how you know
Official websites use .gov
A
.gov website belongs to an official
government organization in the United States.
Secure .gov websites use HTTPS
A lock (
) or https:// means you've safely
connected to the .gov website. Share sensitive
information only on official, secure websites.
