
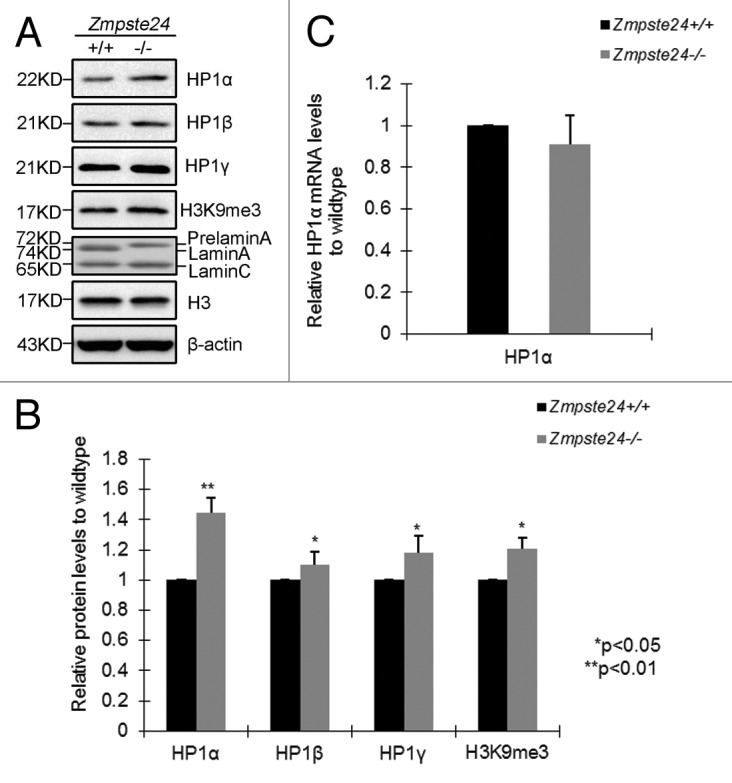
Figure 1. Increased level of HP1α in Zmpste24−/− MEFs. (A) Representative immunoblots showing protein levels of HP1α, HP1β, HP1γ, H3K9me3 in Zmpste24−/− MEFs and wild-type littermate controls at passage 3. (B) Relative levels of HP1α, HP1β, HP1γ, H3K9me3 in Zmpste24−/− MEFs comparing with wild-type littermate controls. Data (mean ± s.e.m.) represent 3 independently derived lines of MEFs in separate experiments. *P < 0.05, **P < 0.01, 2-tailed Student t test. (C) Real-time RT-PCR analysis of HP1α mRNA expression in Zmpste24−/− MEFs and wild-type littermate controls. HP1α mRNA abundance was calculated by 2-△△Ct normalized to β-actin. Data represent 3 independently derived lines of MEFs in separate experiments.