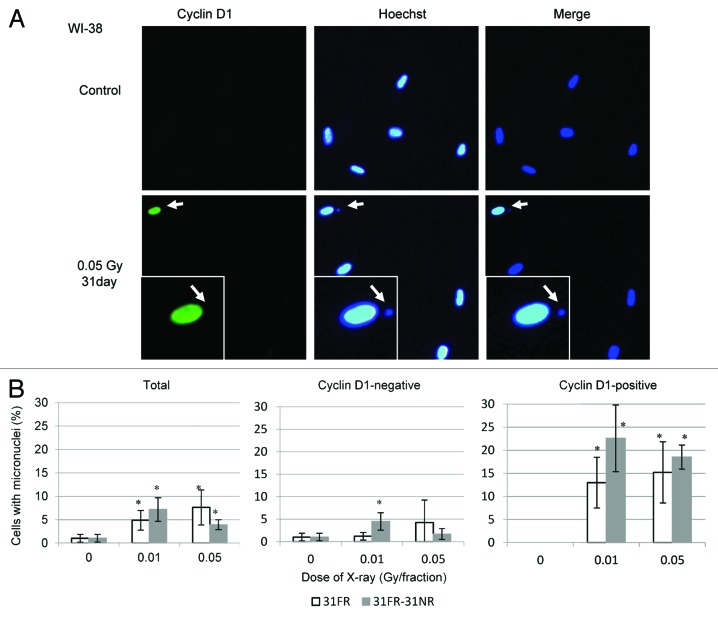
Figure 5. Micronucleus formation in 31FR-WI-38 cells. (A) Images of cyclin D1-positive (green) 31FR-WI-38 cells with micronuclei. DNA was stained with Hoechst. Magnified images of a particular cell (arrow) are shown in the insert. Arrow within the insert indicates the micronucleus. (B) The percentage of cells with a micronucleus is shown for total cells (left panel), cyclin D1-negative cells (middle panel), and cyclin D1-positive cells (right panel). Data for 31FR-WI-38 and 31FR-31NR-WI-38 cells are shown. Approximately 30% of 31FR and 15% of 31FR-31NR cells were positive for cyclin D1.

An official website of the United States government
Here's how you know
Official websites use .gov
A
.gov website belongs to an official
government organization in the United States.
Secure .gov websites use HTTPS
A lock (
) or https:// means you've safely
connected to the .gov website. Share sensitive
information only on official, secure websites.
